The Interest Rate Mega-Trend Ebook and Forthcoming Stocks Stealth Bull Market UpdateDear Reader The New UK Interest Rate Mega-Trend 85 page ebook is now complete and available for download.
Your Direct Download Link (RIGHT CLICK and select "SAVE AS TARGET") for the Interest Rate Mega-Trend Ebook (PDF 2.3meg) - Minimum requirement Adobe Reader V7 or higher which is available for free at adobe.com, also note sever load may be heavy during March 21st and 22nd, so if you experience any problems downloading then try again a little later. The Stocks Stealth Bull Market My next in depth analysis of the stocks stealth bull market trend expectations for the remainder of 2011 is nearing completion, as always my primary motivation is with regards my own portfolio and trading positions, so I have to get it right else I WILL LOSE MONEY! I anticipate this work to be completed and formatted for publishing (including as an ebook) within the next 7-10days. Recap of Stock Market Trend Forecast for 2010 - 02 Feb 2010 - Stocks Stealth Bull Market Trend Forecast For 2010 Dow 10,067 - Stocks Multi-year Bull Market that bottomed in March 2009 will trend Sideways during first half of 2010 attempting to break higher. The second half will see a strong rally to above 12,000 targeting 12,500 during late 2010 . Stocks Bear Market Ahead? Whilst my analysis is under way, readers still have a short window of opportunity (less than 24 hours) to download Robert Prechter's own stock market analysis and forecasts comprising of a 12 page ebook. Download your copy of Robert Prechter's 12-page issue Additionally Elliott Wave international has made available full access to their soft commodity services until Wednesday 23rd March that provides reports on the following commodities.
Learn more and get instant access to EWI's commodity forecasts. Your mega-trends investing and stock index trading analyst. Comments and Source: http://www.marketoracle.co.uk/Article27074.html By Nadeem Walayat Copyright © 2005-2011 Marketoracle.co.uk (Market Oracle Ltd). All rights reserved.
Disclaimer: The above is a matter of opinion provided for general information purposes only and is not intended as investment advice. Information and analysis above are derived from sources and utilising methods believed to be reliable, but we cannot accept responsibility for any trading losses you may incur as a result of this analysis. Individuals should consult with their personal financial advisors before engaging in any trading activities.
You're receiving this Email because you've registered with our website. How to Subscribe Click here to register and get our FREE Newsletter To access the Newsletter archive this link Forward a Message to Someone this link To update your preferences this link How to Unsubscribe - this link
The Market Oracle is a FREE Financial Markets Forecasting & Analysis Newsletter and online publication. | ||||||||||||||||||||||||||

Tuesday 22 March 2011
The Interest Rate Mega-Trend Ebook and Forthcoming Stocks Stealth Bull Market Update
 The Ebook comprises of 4 chapters that contain full analysis and concluding forecasts for UK economy, inflation and interest rates, with the fourth chapter focusing on the implications of interest rate rises for society, housing, gold, silver, bonds and the stock market and comprises 4 chapters.
Monday 21 March 2011
Welcome to our Newsletter
Please keep this email for later reference.
Your email address has been added to the following newsletter(s):
*Market Oracle Newsletter
To update your details and preferences please go to
http://www.marketoracle.info/?p=preferences&uid=c6dac89b760f91c70b3b9ca3b16db2a7.
If you do not want to receive any more messages, please go to
http://www.marketoracle.info/?p=unsubscribe&uid=c6dac89b760f91c70b3b9ca3b16db2a7.
You can access the newsletter archive (delayed updating) here -
http://www.marketoracle.co.uk/Topic19.html
You can download the Inflation Mega-Trend Ebook here (3.2 meg pdf) -
http://www.marketoracle.co.uk/pdf-1016/The_Inflation_Mega-Trend_Nadeem_Walayat.pdf
Thank you
Sarah Jones
Site Administrator
http://www.marketoracle.co.uk
Wednesday 16 March 2011
New Stocks Bull or Deceptive Bear Market? Find Out in This Free Elliott Wave Theorist!
New Stocks Bull or Deceptive Bear Market? Find Out in This Free Elliott Wave Theorist!Don't miss out! This free issue is only available through March 21. Learn more about Prechter’s 12-page issue – it’s yours for free. Dear Investor, The facts are hard to reconcile:
These data points don't go well together. Still, facts are facts -- whether they "reconcile" or not. So, like every individual investor, you have choices to make. Obviously, what you choose depends greatly on what you believe the future holds. It's just that right now, the future seems murky in ways few of us have experienced. Then again, "few" is not "all"... ... Meaning, you could have an astonishing stroke of luck, whereby you cross paths with a market pro who's been around for decades. Maybe even the sort of guy who was "keeping hourly charts by hand back in the 1970s." A guy like that will have just about seen it all. He could compare today's trend with the trends of the past 30 years, because he lived (and worked) through them. Heck, he'd know even more than that, since he learned the trade when he was young from people with decades of their own experience. You probably know where I'm going with this, so I'll spell it out. The Elliott Wave Theorist which published in February includes more of Robert Prechter's experience than I've ever read in a single issue -- all 30-plus years of it. What matters is that he uses his experience at a moment when it can do the most good, namely when investors are most vulnerable. After being "net sellers" for three years, the public is moving back into mutual funds. One simple chart in the above-mentioned Theorist reveals the perils of this trend. So, Prechter has done a comparative analysis of today's stock market, vs. four primary degree (long-term) examples from his own career. In this you'll see his familiarity with market history at the deepest level -- this includes some of the charts he did by hand years ago. An experienced voice is the most important when it's the hardest to hear -- and perhaps the least welcome. This doesn't have to be the case with you. Robert Prechter's analysis begins and ends with facts about the market -- the charts most of all. You owe it to yourself to read this issue of The Elliott Wave Theorist. (Don't delay! It's only available through March 21!) Download your copy of Robert Prechter's 12-page issue -- it's free. Sincerely, Robert Folsom, Senior Editor With EWI since 1992 About the Publisher, Elliott Wave International Founded in 1979 by Robert R. Prechter Jr., Elliott Wave International (EWI) is the world's largest market forecasting firm. Its staff of full-time analysts provides 24-hour-a-day market analysis to institutional and private around the world.
You're receiving this Email because you've registered with our website. How to Subscribe Click here to register and get our FREE Newsletter To access the Newsletter archive this link Forward a Message to Someone this link To update your preferences this link How to Unsubscribe - this link
The Market Oracle is a FREE Financial Markets Forecasting & Analysis Newsletter and online publication. | |||||||||||||
 Home values right now are falling in regions where they had been stable for three years... but, the Dow Industrials recently climbed above 12,000 for the first time since mid-2008.
Wednesday 9 March 2011
UK Interest Rate Forecast 2011, Paralysed Bank of England Still Fears Financial Armageddon
UK Interest Rate Forecast 2011, Paralysed Bank of England Still Fears Financial ArmageddonInflation Mega-Trend Ebook Direct Download Link (PDF 3.2m/b) Dear Reader The UK interest rate in-depth analysis and concluding forecast is more than twice the length of the capacity of the newsletter system, therefore can be read in its entirety by following these two links : Part 1 - UK Interest Rate Forecast 2011, Paralysed Bank of England Still Fears Financial Armageddon Part 2 - UK Interest Rate Forecast 2011 - Conclusion and Implications Britain's coalition government pressed the reset button on the UK Economy during summer 2010, as it has continued to make a plethora of tax raising and spending cut economic austerity announcements over the past 9 months in an attempt to get a grip on the Labour government's legacy of an out of control annual budget deficit of over £150 billion per year that risked bankrupting Britain.
The big gamble that the coalition government is playing is that its programme for economic austerity will prevent market interest rates from rising as they have done so in the bankrupting PIIGS for the whole of 2010 and into 2011, pushing these economies into economic depression. The Coalition governments primary aim is to engineer an economic outcome that sets the scene for a spending and tax cutting induced mini boom into a May 2015 General Election that would favour at the very least a continuation of the Coalition government or more probably an outright conservative victory. However the coalition government faces many headwinds during 2011 that could disrupt its economic plans, most notably soaring inflation that has long since left the UK official target of CPI 2% behind as well as internal political pressures as the Lib Dems buckle under austerity induced dissent , let alone external pressures form first the Euro-zone to more recently imploding Middle East states buckling under their own inflation mega-trends. Therefore this analysis seeks to conclude in a trend forecast for UK Interest rates in determination of the degree to which the Coalition government will be able to manage to keep UK interest rates low (base and market) during 2011 to enable the target trends for the economy to be achieved. Labour's Debt Crisis Legacy Continues As mentioned in the June analysis (29 Jun 2010 - UK ConLib Government to Use INFLATION Stealth Tax to Erode Value of Public Debt ) coalition spending cuts will not prevent total UK debt from increasing by over 50% the next 4 years. This is as a consequence of the budget deficit that will persist into the 3rd year of the cuts programme as illustrated below, which anticipates the abandonment of the cuts programme during 2013 as the Coalition government starts to gear itself up towards generating an election boom into May 2015.
Therefore the Coalition's spending review did not alter Britains' path towards a debt mountain total of £1,262 billion for 2013-14, an increase of 50% on the 2009-10 total of £784 billion (as per original analysis of June 2010).
The impact of a 50% increase in total debt also implies at LEAST a 50% increase in ANNUAL debt interest payments to £70 billion, up from £34 billion for 2009-10, which also illustrates the error in the argument of those that state that the Coalition government is cutting too much too fast when the facts are that it is not cutting any where enough to have any impact on accumulating UK debt. Britain's current debt situation continues to target £118 billion budget deficit for 2011-12. UK Interest Rates - The implications are for the continuing need to keep UK interest rates on hold for 2011 and beyond so as to service the ever expanding debt mountain. Coalition Government Policy Flaws There are two major flaws in the Coalition Governments policies: 1. Socialist Frankenstein Coalition Government Targets Middle Class Taxes The Frankenstein coalition government is adopting socialist measures that squarely targets the middle class to pay for the price for Labour's incompetence, far worse than that which the labour government had planned to do by effectively taxing the middle class to over 70% of their earnings (40% Income Tax + 12% NI Tax + 20% VAT + 5.1% RPI Inflation (inflation is a stealth tax that the population has been conditioned to view as beneficial when it is actually an earnings and savings purchasing power destroyer). Government Spending Cuts The policies announced to date only pay lip service to spending cuts on an out of control welfare state with the largest budgets that deliver no output for additional resources such as the NHS being ring fenced for growth. The consequences of this is that government spending will NOT be cut and instead continue to increase every year from £680 billion for 2009-10 to at least £739 billion for 2014-15.
There are two important factors to take into account when considering the headline grabbing statements of departmental cuts of upto 30%. a. That the cuts will be phased in over 4 years. b. That inflation of approx CPI 3% to 4% per year has to be considered. This means that allowing for the impact of inflation AND phasing in means that actual spending cuts will be far less in both nominal and percentage terms because inflation annually will lift the spending budgets that are being subject to phased nominal cuts. For example a £100 billion budget in a year would rise to £103 billion after 3% inflation, therefore a £10 billion cut over 4 years would itself be indexed for inflation which it would not be if all of the the cuts took place in the first year. I.e. in the example £10 billion of cuts in the first year would result in a year 4 budget of £101.7bn, whereas phased in cuts of £10 billion would result in a budget total of £102.2bn as a consequence of inflation. Therefore as per the example, the total actual cuts over 4 years would be £23 billion against £40 billion if all if the £10 billion was immediately cut. The following graph translates the announced cuts into spending department budget totals as phased in over the next 4 years (2014-15) after being indexed for inflation at a conservative 3% per year.
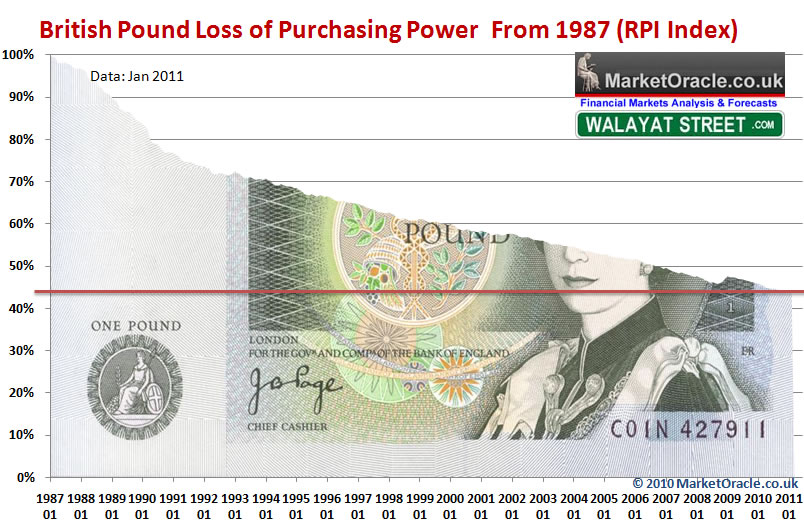
Therefore the coalition government is failing to implement ANY meaningful cuts in what remains out of control Government spending. Tuition Fees The coalitions policy on tuition fees illustrates a government that is anti-education and destroying the ability of the country to generate future wealth. 1. Tuition Fees will rise from £3,300 to £9,000 saddling graduates with an estimated average debt of £40,000 with all of the consequences both psychological and financial in terms of credit ratings where the debt will impact on graduates for the next 30 years of their working lives. 2. That the debt interest will be at Inflation (RPI) Plus 3% (8.1%), against the current student loan interest rate of 1.5%. 3. Those that pay off their loans off early will be punished, and unpaid debt will be wiped out after 30 years. 4. Repayments will kick in for those earning at £21,000 rather than £15,000, which effectively punishes those that are more productive and acts as a disincentive to work harder, and every year workers delay working harder for higher pay means loss of potential tax revenue, which suggests that the Government is grossly over optimistic in what it expects these workers will earn in the future which is based on growth in graduate pay of the past 30 years when there were far fewer graduates who were NOT saddled and disincentivised to work with £40k of debt repayments. Which also means that perhaps as much as 50% of the monies loaned will never be repaid. The overall effect is to make university education less palatable to all sections of the population as all will feel the financial and psychological pressure of being saddled with £40k of debt as soon as they leave University and try and get their first entry level job, especially as the high interest rate ensures that the debt total will continue to soar at a rate that is greater than average earnings growth. Instead of turning students into debt slaves for life, the government should view graduates as the countries life blood who will go on to become higher rate tax payers and therefore they should be incentivised to work harder for more pay and therefore pay more taxes, which is the exact opposite to the coalition governments policy Key to the countries future is always in the quality of those that enter the Labour force, therefore education should be free so as to maximise the educated worker population pool that will maximise the higher tax payer base, after all middle class tax payers are taxed at an extortionately high rate of approx 70%. UK Interest Rates - Whilst the mainstream press and vested interests in the public sector focus on headline grabbing spending cuts and tax rises, the facts are that a highly inflationary LARGE BUDGET DEFICIT will continue to persist regardless, that coupled with inflationary tax rises as the population responds by demanding higher wages to compensate, the Bank of England / government understands this as a policy for high inflation to devalue the value of the deficit and total accumulated debt, therefore regardless of what the Bank of England states publically, the actual policy is for high inflation plus low interest rates. 2. Protecting the The Socialist Banking System The Coalition (as did Labour before) have let off hook those who are responsible for the financial crisis i.e. the banking sector with the Bank of England at its head. Many mistakenly jump to the conclusion that capitalism was to blame for the financial crisis. However it was not capitalism to blame but socialism, because if there was any doubt in anyone's mind that the banking system that operates in all of the western countries is socialist, then the bailout and protection of the bankster's and their bonuses should have put that to rest. The power to print electronic money is delegated from the central bank by means of fractional reserve banking which creates the booms and boosts between alternating trends of out of control credit creation followed by credit destruction with high inflation always seen as the solution. BoE governor Mervyn King also apparently same to this conclusion : “Of all the many ways of organising banking, the worst is the one we have today.” “What we cannot countenance is a continuation of the system in which bank executives trade and take risks on their own account, and yet those who finance them are protected from loss by the implicit taxpayer guarantees.” However what Mervyn King will never acknowledge is the fact that the Bank of England is THE PRIMARY REASON why the banking crisis occurred, because it lies at the very heart of Britains fractional reserve banking system that allows bankster's to bank bonuses on the basis of fictitious tax payer funded profits and then dump the losses onto tax payers i.e. profits are privatised whilst the losses are nationalised. The Bank of England will never allow real radical reforms to end the socialist banking system because that would result in an end to fractional reserve banking, and if there is no more fractional reserve banking then there is no need for the Bank of England to exist. Therefore Mervyn King is talking a load of nonsense that he does not even agree with as the Bank of England aims are to grab more power from Parliament so that more money can be fraudulently funneled into the hands of a few thousand bankster's that Mervyn King is literally the King of! If the UK government were not in the back pockets of the Bankster elite then they would be taking powers away from the Bank of England instead of handing over more powers to the Bank to print money and inflate the wealth and purchasing power away of hard working citizens that have increasingly been turned into debt slaves, families now work twice as hard as they did 20 years ago with less purchasing power as a consequence of the theft of purchasing power by means of continuous money printing / credit creation (electronically) via the factional reserve banking system that continues to destroy the value of the currency in real terms as the following graph illustrates -
The only way to stabilise the value of money and prevent a future banking crisis (which is guaranteed) is to end fractional reserve banking so that Banks can only loan out what they have received in deposits. Instead, our current fraudulent banking system exists where the Bank of England prints money that is loaned out on leverage to the bankrupt banks so that they can go and buy government bonds on even more leverage, resulting in huge profit margins for near zero risk. The Banks then treat these government bond holdings as assets against which they can create many multiples of electronic money in the accounts of borrowers, loaned out at exuberant interest rates in many cases X20 the rate of the base interest rate that Banks can borrow at from the Bank of England. The system is designed to generate literally unlimited profits for the bankster elite, and if the banks lend too much then the socialist banking system ensures that the ordinary tax payers will be forced to step in and bailout the banks at any cost and ensure that all bond holders are protected at 100%. This is NOT capitalism, this is socialism. Capitalism is a mechanism for the allocation of capital towards whichever business is profitable, and as long as the business is profitable the business is financed, if the business stops being profitable then capital is reallocated to other ventures that could prove profitable. Capitalism is not conjuring money out of thin air that is loaned out to ANY business whether it is viable or not amidst a credit boom (as there is unlimited money), and then when the bubble bursts have tax payers step in and cover ALL of the banking sectors losses after bank officers have banked bonuses on fictitious profits, leaving hollow husks behind for the tax payers to cover the liabilities of. That is not capitalism, this is fraud on the tax payers of Britain, far greater than any mafia don could ever hope to achieve. Interest rates are near ZERO so as to allow the bankrupt banks to maximise the amount of profits they can make as they borrow at 0.5% and then leverage it up by the fractional reserve banking system to between X10, X20 and higher, then go on and buy government bonds at 3% which implies an instant profit 25% to 50% all courtesy of the Bank of England and Tax payers. In America the tea party movement has risen up against the blatant frauds that are taking place such as Hank Paulson, the ex CEO of Goldman Sachs effectively engineering a £700 billion theft from taxpayers to the bankster's. Isn't it time for the middle class of Britain to also wake up to the fraud of the socialist fractional reserve banking system that seeks to destroy the value of a life time of savings? David Cameron's coalition government is not showing any vision, instead it is magnifying the policies that the Labour government had planned to implement and even more eager to protect the Bankster Elite that many Conservative MP's hope to join on leaving office. So Britain does appear ripe for a Middle Class led Tea partyesk movement across Britain to cut taxes from 70% and out of control government spending and destroy the power of the bankster elite that the country remains firmly in the grips of. UK Interest Rates - One of the primary objectives of Bank of England's is to continue to funnel tax payers cash onto the balance sheet of the bankrupt banking sector for which low interest rates is one of the primary mechanism as the Bank of England remains petrified of the potential for the Banking Sector to trigger Financial Armageddon. UK Economic Growth Implication for Interest Rates The UK Economy apparently went into reverse gear on the recent release of shockingly bad preliminary GDP data for Q4 2010 of -0.5%, against economist expectations averaging at +0.5%. George Osbourne and other Coalition government ministers immediately stepped forward to blame the weather. However the snow at worst accounts for 0.4%, therefore most of the drop of 0.6% (1% difference) is due to retrenchment ahead of austerity to bite during 2011 as private sector firms seek to protect themselves against weaker demand by bolstering balance sheets. Therefore UK economy can be expected to recoup the -0.4% contraction due to weather during Q1 2011, which implies better GDP for Q1 than originally forecast as economic activity literally froze during December now takes place during January and February (barring further bad snow fall). Additionally the preliminary data is deemed to be overly gloomy, and thus can be expected to be revised higher from -0.5% towards -0.2%, therefore net difference between actual and expectations is estimated at 0.3%, far lower than the 1% headline difference as the UK economy is not quite as weak as the all of the press headlines suggest. The below graph illustrates the forecast trend for UK GDP (ABMI chain linked at market prices, change on year earlier). The UK GDP Growth trend forecast was updated following the June Emergency Budget that resulted in a revision for 2011 growth from +2.3% to +1.3% (09 Aug 2010 - UK Economy GDP Growth Forecast 2010 to 2015).
My expectations remain for Growth of between 1% and 1.5% for the next 3 years.The Coalition government is constantly being pulled in two directions one socialist and one free market orientated. This makes it less able to react to bad economic news and therefore suggests that the coalition government is terrified at the risks of another recession over the coming years and rising unemployment. This suggests that the Coalition government will want to avoid interest rates rising for as long as possible,which also ensures further QE and therefore this part of the analysis points to continuing low interest rates throughout 2011. UK Interest Rates - Contrary to the public statements of the Bank of England of targeting 2% inflation, the actual facts are that the Bank of England since October 2008 is more focused on targeting a minimum of 2% GDP, which given recent data illustrates a reluctance for the Bank of England to raise interest rates until it see's annual GDP north of 2%. However, the failure of the Bank of England to respond to high inflation is not sending a reassuring message to industry to invest, therefore to strengthen the economy, ironically the Bank should give 1 or 2 token rate rises. which given the forecast trend therefore suggests a great deal of reluctance to raise interest rates during the next few years. Bank of England Ignoring Inflation, UK Stealth Government Debt Default Trend UK Inflation for January 2011 leapt to CPI 4% from 3.7%, leaving the Bank of England Governor, Mervyn King to press print on another letter full of worthless excuses as to why high Inflation is still temporary more than a year on. The facts are that the Bank of England via its policy of HIGH Inflation is destroying a lifetime of accumulated capital of savers, as interest earned on savings after tax will be lucky to be at HALF the official inflation rate, never mind the actual inflation rate that is nearer to 6.6%, all as part of the continuing programme for the transference of wealth from tax payers and savers onto the balance sheets of the bailed out banks that generate fictitious profits on the basis of which billions are paid out in bonuses. The more widely recognised measure of Inflation RPI stood at 5.1% and real inflation at 6.6%, as the official inflation indices have been systematically doctored to under report real inflation by successive governments for several decades resulting in serious and compounding under reporting of the real rate of inflation as experienced by the British population. The Bank of England MPC members continue with their mantra of temporarily high inflation due to short term factors. One could cut and paste from any inflation statement from MPC members of the past 12 months to hear the same propaganda out of the Bank of England. The question everyone should be asking the BoE is when does temporary high inflation stop being temporary? Originally it was for a couple of months, now it is over a year, will high inflation still be temporary a decade from now? For that is how long I expect the Inflation Mega-trend to run. The updated in-depth analysis and forecast for UK inflation for 2011 (17 Jan 2011 - UK Inflation Forecast 2011, Imminent Spike to Above CPI 4%, RPI 6% ) concluded in UK inflation spiking to a high of 4.2% early 2011, and thereafter trend lower towards 3% by the end of 2011 and therefore remaining above the Bank of England's 3% upper limit for the whole of 2011. The Bank of England's most recent Inflation Report forecast UK CPI of 1.7% by the end of 2011, however the BoE had forecast UK CPI of just 1% by the end of 2010 (Feb 2010), which is inline with the Bank of England's permanent mantra of near always imminent deflation so as to better manage the populations inflation expectations in their favour.
The UK government continues to stealth default on its government debt at a real inflation rate of at least 6% per annum, a price that is being paid for by all workers and savers. The population of Britain has been successfully conditioned by successive governments deploying the pseudo science of economics that appears to exist purely to enable governments to psychologically manage the expectations of their populations such as coming to believe that the stealth sovereign debt default trend is good for them. INFLATION is pure and simple THEFT by the government for the primarily purpose of enabling governments to exist in ever expanding size and scope of interference in everyday lives for without INFLATION i.e. in a normal deflationary world, in which big governments would not be able to exist because accumulated debt would INCREASE in value, thus ensuring that large long-term borrowings could not be entertained in an 'normal' deflationary environment. Yes given technological innovation then deflation should be the normal environment for an economy, if it where not for big governments with big ideas on how to stealth tax the populations wealth and spend it on even bigger and usually worthless projects. Another word one could use for deflation is productivity, each year the productivity of workers increases due to innovation and new technologies which means that the price of goods and services should fall as workers become more efficient in their production and thus the value of hours worked increases. Off course this only tends to happen in the private sector as the public sector ironically becomes LESS productive the bigger it becomes as the number of bureaucrats expands exponentially until the economy folds under its weight, as witnessed by the NHS where a tripling in the budget under Labour has basically resulted in a tripling in the number of bureaucrats employed. This puts the economy into a perpetual worsening state as the Public sector displaces the far more productive and competitive private sector both on the large and small scale, for example small local post offices have been closing across the UK due to lack profitability. However many councils have responded by stepping in to re-open some of the small post offices with grants of say £50k a year towards their running costs, therefore no tax paying private sector postal service will ever be able to again step in to provide a service as it cannot compete against a perpetually subsidised loss making local postal service. So in our topsy turvy government brainwashed world, we are repeatedly told that DEFLATION is bad, if not evil, and that INFLATION is good, something to leap with joy at the prospects of seeing our wealth disappear down the inflationary spiral. Governments love inflation because it allows them to expand the size of the state which is the natural instincts of ALL governments no matter the political party, as once politicians get into office then out goes the ideology that they used to get elected and off they run to enjoy the trappings of the state as they seek to make their mark on history. You may at this point interject and state that the current UK coalition government is issuing statements left right and centre that it intends on cutting this that and the other to get a handle on the countries public debt mountain! Only one problem, the coalition government is not going to cut the debt at ALL! they can't cut the debt because the last Labour government has ensured that the gap between that which the government spends and earns is unbridgeable, all that the governments can do is erode the purchasing power of all workers and savers in the economy through inflation which devalues the value of the current total debt of approx £1 trillion with at least another £250 billion due to be added over the next few years, that THIS so called spending cutting government will rack up during which is why the Bank of England and Treasury pump out propaganda on the economy that never matches reality such as that the inflation rate is always destined to converge to 2% in 2 years time. for example if UK inflation compounds to 28% in 4 years time (RPI 5% per annum), then that means total debt of £1.2 trillion would be worth £864 billion i.e. Little change from the present! Hey presto the budget deficit is gone whilst the debt burden remains constant. But who has paid the price for this apparent miracle? The bond holders, savers and workers by means of inflation AND taxes on illusory nominal economic growth due to inflation. How Much of Your Wealth Has Been Squandered by the Last Labour Government ? Well for that we have to take a look at the governments preferred inflation measure, the CPI index which despite under reporting real inflation still shows that the Labour government between April 1997 and May 2010 stealth taxed your wealth and earnings to the tune of 28% to give you the illusion of prosperity, whilst all the time enabling the government to go on an unfunded public sector spending spree to grease the palms of those who are most likely voted Labour. However the problem is that the greater the debt burden in terms of % of GDP then the greater will be the future rate of inflation, which currently looks set to wipe out another 28% of the value of your wealth during the next 5 years which will be WITHOUT the benefit of illusory inflation linked pay rises.
Savers at this point may argue that they receive interest on their savings or enjoy capital gains on invested assets (despite the financial crash and bankster designed fraudulently investment instruments that result in only making money for the financial institutions rather than investors). The government has thought of that too and steps in with ANNUAL taxes at the marginal rate on interest at 20% to 40% (depending on your tax band), and capital gains are also taxed. Which ensures savers / investors are going to find it very difficult to prevent the government from stealing your wealth as the system is designed to virtually guarantee that your wealth will eventually end up in the Treasury. On the other hand if there were no inflation then the rate of income tax on interest would not matter as you would always earn more than the inflation rate which is ZERO and neither would capital gains tax matter. Still it gets even better during deflation where due to increasing productivity general prices should fall so the value of your savings even if the rate of interest is ZERO increases, off course governments cannot allow for deflation because they are no longer able to steal your wealth. UK Interest Rates and Inflation Risks So to gauge when UK interest rates will rise, we need to gauge what level of inflation will the coalition government consider as dangerous for the economy, as clearly 4% despite being above the BoE target is being ignored. I suspect that the Bank of England and Government have privately long since geared themselves up for substantially higher inflation for many years, far beyond the upper limit of 3% which will come to be seen as period of low inflation as a consequence of the need stabilise public sector debt in terms of percentage of GDP especially if the government expects to achieve its target for debt at 65% of GDP by 2015-16 which I just do not see as being possible, the most probable outcome is debt stabilising at an inflation induced 71%.
UK Interest Rates - As mentioned earlier, the Bank of England's PRIME consideration is NOT the targeting of 2% CPI Inflation but 2% GDP, additionally the Bank of England also targets the monetization and devaluation of government debt and support for the bankrupt banking sector, so has multiple targets, the weight if which is favouring the maintenance of low interest rates. Risk is that the Bond Markets puke on the relentless supply of public debt, especially as the Government is expected to fail to achieve its deficit and Debt to GDP reduction target, impact probably delayed to 2012. Global Inflation Those in other countries such as the United States are on a similar path to the UK, which similarly implies much higher future inflation as a consequence of their own stealth debt default trend. In fact the longer the U.S. Fed delays in forcing up US interest rates then the higher it will have to spike in the future as the larger will be the debt burden to deal with in terms of % of GDP. Therefore academic expectations for Deflation in the USA (deflationistas have become more rare in the UK) is a continuing construct of delusional freakanomics. Deflation Delusion Persists You still continue to hear a lot of deflation in the BlogosFear and mainstream press, however the whole deflation argument is a delusion the reasons for which I covered at length in an earlier article (26 Aug 2010 - Deflation Delusion Continues as Economies Trend Towards High Inflation). Basically deflationists are living in either the 1930's or somewhere in ageing population shrinking Japan. They are not living in either the UK or the USA or much of the rest of the world. Deflation in our fraudulently fiat money printing central bank governed world cannot exist, not whilst governments run budget deficits that continue to pile on ever more debt that demands inflation to erode its real value away as already mentioned earlier and the price for which is being paid for by the CURRENT generation not future generations which is another consensus driven myth that exits purely to condition the population into accepting the frauds of deficit spending, debt accumulation and inflation. Delusional deflationists that populate the mainstream media have been instrumental in ensuring that the likes of the stocks stealth bull market (02 Feb 2010 - Stocks Stealth Bull Market Trend Forecast For 2010) will continue to run for many years because they miss the most fundamental fact that asset prices are leveraged to consumer prices. Deflationists say don't worry if the data does not fit, just change the methodology, as I warned would happen nearly a year ago that once proved to be wrong the deflationists will attempt to either rewrite history or change the definition of what inflation actually is which is precisely what is happening today (18 Nov 2009 - Deflationists Are WRONG, Prepare for the INFLATION Mega-Trend ). Such as attempting to change the debate from Deflation vs Inflation to Deflation vs Hyperinflation ! When Hyperinflation is the END GAME ! When populations PANIC and lose confidence in the currency and hence dump it for anything from consumer goods to hard assets, which in our fast moving financial world probably mean that hyperinflation would occur within a matter of hours rather than months as Weimar Germany experienced during the 1920's. So hyperinflation is akin to market crashes i.e. something that cannot be forecast as to when it will occur but rather one can protect themselves from in advance of by engaging in Wealth INFLATION PROTECTION strategies rather than following the bankrupting deflationists recommendations such as parking ones money in cash or government bonds which are guaranteed to lose you ALL of your money as the first signs of hyperinflation would occur in the bond and currency markets, long before prices in the shops soar and the lagging official inflation indices surge higher! Inflation and Tax Rises Crush Britain's Middle Class, Real Earnings 25% Drop! UK annual earnings grew at an annualised rate of 1.1% (December 2010), this compares against the official UK inflation rate of CPI 4% and the more recognised RPI at 5.1%, with the real UK inflation rate as experienced by most of the people of Britain running at 6.6%. Clearly Britain's workers are being squeezed hard by a multitude of government policies that manifest in negative real earnings growth as the government seeks to use the stealth tax of inflation to erode the value of the ever expanding public debt mountain, where at least half of the annual budget deficit is as a direct consequence of the fraudulent actions of the banking sector, the price for which is continues to be paid for by the workers of Britain.
The UK Average earnings graph illustrates the real terms loss of purchasing power of earnings against both of the official inflation measures (CPI, RPI) which may surprise many to learn is not a recent phenomena but that the trend of negative real earnings growth has been in force since mid 2008 and is now approaching 3 years of punishment for workers for the crimes of bankster's that makes a mockery of the propaganda being pumped out by vested interests in the banking sector and coalition government that the tax payer is sitting on profits on banking sector capital injections (which I will came back to later in this article). The in-depth analysis and forecast for UK inflation for 2011 (17 Jan 2011 - UK Inflation Forecast 2011, Imminent Spike to Above CPI 4%, RPI 6% ) concluded in UK inflation spiking to a high of 4.2% early 2011, and thereafter trend lower towards 3% by the end of 2011 remaining above the Bank of England's 3% upper limit for the whole of 2011. However, crude oil going super nova as a consequence of the breakout of freedom in the middle east, that could result in the oil price spiking as high as $200 would see UK CPI break above 7%, resulting in a far worse blood bath for the workers of Britain than the on going bankster bailout feeding frenzy.
Middle Classes To Lose as Much as 25% of their real earnings. Whilst the poor can rely on benefits and the rich can rely on capital growth to profit from asset markets being inflated by the central banks far beyond the official inflation indices. However that leaves 70% of the British population that class themselves as being middle class to feel the full force of the Inflation and economic austerity mega-trend. Whilst many students (middle class wannabe's) have woken up to a near tripling of the debt burden they will be placed under, however, the situation for Britains vast middle class is set to get far worse than that which even the dire inflation outlook implies because on top of the inflation stealth theft of wealth and wage purchasing power there are a series of tax rises and benefit cuts due to hit the middle class workers of Britain and especially those with children as taxes rise such as national insurance, and tax allowances are cut, and benefits (tax reimbursements) such as tax credits are reduced and in many cases totally withdrawn which means middle class workers could be hit by an additional loss of earnings purchasing power of 5% per annum on top of the real inflation theft of at least 3% per annum, none of which features in any Bank of England or Government economic propaganda report. Whilst trying hard to refrain from using expletives here, but the middle class of Britain is truly FQ&*ED! Middle class families will typically be poorer by between 15% and 25% by April 2013, as from Jan 2013 many benefits will be cut such as the universal tax free child benefit payments being ripped away that alone amount to a loss of 7% of disposable income for a £45k wage earner with 3 children, that is destined to break the backs of many a middle class family fighting hard to stay above water in the wake of soaring prices. Tip - The way for workers to avoid loss of child benefit is to ensure each parents taxable earnings are below £42,375, one way to achieve this is to make a payment into a personal pension fund that would bring taxable earnings to below £42,375. There are a number of other mechanisms such as salary sacrifice and using cash ISA's to have savings interest excluded from taxable earnings. To illustrate the severity of the situation, the loss of 15% to 25% of real earnings needs to be compared against the accumulative loss of purchasing power of approx 4% under Labours disastrous last 2 years in power, as Labour effectively sought to bankrupt the country so as to maximise seats won at the May 2010 General Election and deliver the Conservatives a scorched earth economy as I began warning of since at least mid 2009 (31 May 2009 - Labour Governments Bankrupt Scorched Earth UK Economy for the Conservative Government ). There will be a great deal of pain, for worse than anything experienced during that of at least the past 30. The workers of Britain need to prepare themselves for this pain by taking action now to both protect their wealth and pay down debts as this trend given the governments persistently high budget deficit that continues to accumulate a ever higher debt mountain is likely to last for the whole of this decade. The net result of the inflation and economic austerity mega-trend will be that a decade from now half of the middle class will have disappeared and have been forced to join the working class. It is not too incredulous to suggest that where the middle classes of Egypt is today is where the middle class of Britain will be in 10 years time, the politic consequences of which will be for the re-birth of socialism which will mean far greater long-term economic pain for everyone! Inflationary Wage Price Spiral The risk that the Bank of England and Government is running is that people feeling real pain of contracting real earnings see through the Smoke and Mirror statistics of nominal growth and realise that persistent high INFLATION is pure and simple THEFT of their wealth and start demanding far higher pay rises than the official inflation rate, which I am sure that the implementation of the austerity cuts will act as a triggering mechanism for, this will make all workers far more militant and therefore many more strikes will breakout during 2011 and into 2012-2013 as the middle class of Britain revolt against severe contraction in earnings and erosion of wealth. The effect of many more striking workers will be INFLATIONARY, because even marginally less goods and services produced act to force up prices, a ratcheting up effect, the higher inflation goes the less control the government or Bank of England will have over inflation as it will become LESS responsive to future interest rate hikes because people start to lose faith in the currency, as they don't want to hold onto something that is fast losing its value, they want to get rid of it, SPEND it on goods and services that they will find increasingly difficult to purchase with diminishing real wages. Governments are always playing a dangerous game with inflation because governments NEED inflation to DEVALUE the DEBT, but populations REACT to persistently real high inflation by increasingly demanding higher pay far beyond that of discredited official inflation indices i.e. to make up for the shortfall in tax rises and benefit cuts that is expected to range upto 25% per annum loss of purchasing power by April 2013, and thus become highly reluctant to hold onto fiat currency as they seek to consume goods and services as soon as possible, and savers seek out hard assets or alternative currencies. Another point to consider is that the spark for high inflation has already been lit by the budget busting mega black hole across the Atlantic that is burning the worlds reserve currency as though there is no tomorrow, in which respect there is no way that the British Pound will be able to escape its event horizon as both the dollar and sterling are heading for the same final destination regardless of volatility between the currency pairs that gives the illusion of a rising pound. The implications for UK interest rates will be covered in my next in depth analysis and concluding forecast to be imminently completed, ensure you are subscribed to my always free newsletter to get this analysis and forecast in your email in box. UK Interest Rates - The Bank of England primarily fears the wage price spiral, ironically raising interest rates could contribute towards igniting the wage price spiral as it would put the highly indebted workers of Britain under even greater stress that would manifest in worse civil unrest, strikes and more forceful wage demands. Therefore as there is no sign of an imminent wage price spiral given average earnings growth of just 1.1%, rate rises during 2011 would be counter productive. Crude Oil Goes SuperNova Implications for Inflation and Interest Rates The inflation forecast for 2011 warned that the key risks to the forecast were all to the upside and specifically if Crude oil were to go super nova during 2011, subsequent events starting in Tunisia, magnifying in Egypt and now exploding in Libya have sent crude oil prices soaring into the stratosphere as speculators pile into a panic sparked trend, where Brent Crude has now spiked higher to $115 on the spot market, up $40 from the recent trading range of $75 and leaving the US WTI Crude presently lagging behind at $101.
Brent Crude oil of $115 if sustained would translate into an inflation rate of CPI 5%+ as prices at the pumps are ratcheted higher by at least 7p per litre, however the explosion taking place in the middle east appears to be just beginning as the freedom storm turns to the oil rich gulf states with the mafia dictatorship of Saudi Arabia at its head. However it is not necessary for the these mafia chiefdoms to actually collapse, rather the risk alone is enough for speculators to pile in and producers hoard crude oil in lieu of higher future prices, that could send the crude oil prices soaring to first break the 2008 $150 peak and then target a break of $200 amidst a short-lived mega-spike. Whilst it is not possible to forecast where crude oil prices will exactly peak, however it is possible to estimate where Brent crude of $150 would translate into an UK CPI Inflation rate of 6%, and $200 of 7.5%, especially given the fact that Sterling today is much lower than where it was during the Commodity spike of mid 2008 as the below graph illustrates that crude oil in sterling is already within touching distance of its all time 2008 high rather than which is suggested by the dollar price that the mainstream press mistakenly exclusively focuses upon.
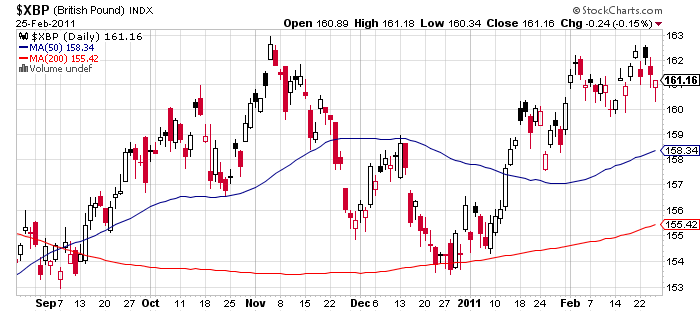
The above graph shows a tendency for crude oil prices (in sterling) to act as a leading indicator for UK inflation of between 6 and 18 months. With normal expectations for a lead of between 6-12 months, depending on the overall state of the economy, which given that the UK economy is in a slow recovery mode then the tendency will pull the lead against UK inflation nearer towards 6 months. The strong trend higher in crude oil during 2009 has resulted in high UK inflation throughout 2010. The current surge in sterling crude oil prices, even if it succumbs to some profit taking in the short-term looks set to translate in a summer UK CPI inflation rate of 5%+. UK CPI Inflation at 5%+ would make a mockery of the deflation fools that populate the Bank of England's Monetary Policy Committee that have mistakenly beaten the deflation drum for the whole of 2010 and into 2011. Inflation of 5%+ would put increasing upward pressure on UK Interest rates as the markets would force the Bank of England to raise interest rates so as to continue to service a still huge government budget deficit via the bond markets that targets £120 billion for 2011-2012. Therefore the outcome as I first voiced over 6 months ago (26 Aug 2010 - Deflation Delusion Continues as Economies Trend Towards High Inflation ) would start to manifest itself in that the Bank of England would both raise interest rates AND print money so as to monetize government debt as the market interest rates would otherwise have to be far higher than what has been an increasingly irrelevant base interest rate would imply i.e. above 4% for 10 year gilts. UK Interest Rates - Crude Oil being sustained in the range at $110 to $120 would.... UK Interest Rates - Crude Oil being sustained in the range at $110 to $120 would result in Bank of England being forced by the market to raise interest rates to hold sterling debt (government bonds) as well as reduce commodity price pressures by pushing the British Pound higher regardless of the consequences for lower economic growth. UK Interest Rates - Crude Oil being sustained north of $150 would result a global recession and trigger panic at the Bank of England and around the Coalition Governments Cabinet table, this would result in interest rates being kept low, and more money printing so as to generate economic activity regardless of the inflationary consequences. British Pound, Inflation and Interest Rates Sterling's bounce of of the December floor of £/$1.54 to currently hover around £/$1.62 illustrates market confidence in the new governments austerity measures relative to that of the United States and even more so when one looks at the bankrupting PIIGS of the euro-zone.
My last in-depth analysis and concluding forecast for was for a volatile up-trend towards a target of £/$ 1.85 by Mid 2011 as illustrated by the below graph (04 Oct 2010 - British Pound Sterling GBP Currency Trend Forecast into Mid 2011 ) .
Though as is always the case, a rise in sterling is just a manifestation of the relative volatility between currencies that are all in state of perpetual free fall against one another due to the fact that the money via various means such as fractional reserve banking, or more overtly Quantitative Easing is constantly being printed therefore currencies are constantly losing value that is measured by the inflation indices, whether official CPI 4%, RPI 5.1% or more realistic MO 6.6%. Therefore holders of any fiat currency should seek to minimise the time for which it is held as holders cycle between differing asset classes. Whilst an upward trend in sterling will reduce inflationary pressures and thus make interest rate rises less likely, however contrary to the consensus view of academic economists, that interest rises drive currencies higher. In actual fact currencies, in this case the British Pound acts as a leading indicator for interest rates in that sterling starts to rise well before interest rates start to rise, anywhere from 1 to 2 years before hand, given that sterling bottomed in Jan 2009 and then again in May 2010, a minimum lead time of a minimum of near 1 year now exists for base interest rates to start to rise. UK Interest Rates - Sterling trend leads UK base interest rates by usually between 1 and 2 years, which given the two lows of Jan 2009 and May 2010, buts sterling into this time window that signals rises in base interest rates. The consensus academic view is therefore wrong that interest rate hikes push currencies higher, when the actual fact is that interest rates follow currency trends, instead academics will focus on why a strong currency means interest rates should not rise, which is the exact opposite (so wrong as usual). .... The UK Interest Rate Forecast 2011 Analysis Continues in Part 2 Source and Comments: http://www.marketoracle.co.uk/Article26766.html By Nadeem Walayat Copyright © 2005-2011 Marketoracle.co.uk (Market Oracle Ltd). All rights reserved.
Disclaimer: The above is a matter of opinion provided for general information purposes only and is not intended as investment advice. Information and analysis above are derived from sources and utilising methods believed to be reliable, but we cannot accept responsibility for any trading losses you may incur as a result of this analysis. Individuals should consult with their personal financial advisors before engaging in any trading activities.
You're receiving this Email because you've registered with our website. How to Subscribe Click here to register and get our FREE Newsletter To access the Newsletter archive this link Forward a Message to Someone this link To update your preferences this link How to Unsubscribe - this link
The Market Oracle is a FREE Financial Markets Forecasting & Analysis Newsletter and online publication. | ||||||||||||||
 These policies on face value imply severe economic distress for several years as they are implemented starting in 2011 and thus require the continuing lubricant of near zero interest rates backed up by quantitative easing aka money printing to inflate the economy (consumer and asset prices) in an attempt at offsetting public sector deflation so as to prevent a nominal double dip recession.
Tuesday 1 March 2011
March Home Buyer's Newsletter
at the end of the newsletter.
+++++++++++ March 1, 2011 +++++++++++++++++++
CONTENTS:
Introduction: Resales Climb, New Sales Drop
Mortgage Rate Update: For Month, Rates Up Again
This Month's Tip: Keeping it Under Control
++++++++++++++++++++++++++++++++++++++++++++
Introduction: Resales Climb, New Sales Drop
Sales figures for January are in and there were surprises
in both resale and new home sales. Resales were a bit
higher than expected and new home sales, where a drop was
forecast, were even lower than was expected.
The uptrend in existing-home sales continues, with January
sales rising for the third consecutive month with a pace
that is now above year-ago levels, according to the National
Association of REALTORS®.
Existing-home sales, which are completed transactions that
include single-family, townhomes, condominiums and co-ops,
increased 2.7 percent to a seasonally adjusted annual rate
of 5.36 million in January from a downwardly revised 5.22
million in December, and are 5.3 percent above the 5.09
million level in January 2010. This is the first time in
seven months that sales activity was higher than a year
earlier.
Lawrence Yun, NAR chief economist, said the improvement is
good but could be better. "The uptrend in home sales is
consistent with improvements in the economy and jobs, which
are helping boost consumer confidence," Yun said. "The
extremely favorable housing affordability conditions are
a big factor, but buyers have been constrained by unnecessarily
tight credit. As a result, there are abnormally high levels
of all-cash purchases, along with rising investor activity."
A parallel NAR practitioner survey shows first-time buyers
purchased 29 percent of homes in January, down from 33 percent
in December and 40 percent in January 2010 when an extended
tax credit was in place.
Investors accounted for 23 percent of purchases in January,
up from 20 percent in December and 17 percent in January 2010;
the balance of sales were to repeat buyers. All-cash sales rose
to 32 percent in January from 29 percent in December and 26
percent in January 2010.
In new construction, sales of new single-family houses in
January 2011 were at a seasonally adjusted annual rate of
284,000, according to estimates released jointly February 24th
by the U.S. Census Bureau and the Department of Housing and Urban
Development. This is 12.6 percent (±11.2%) below the revised
December rate of 325,000 and is 18.6 percent (±15.4%) below the
January 2010 estimate of 349,000.
The median sales price of new houses sold in January 2011 was
$230,600; the average sales price was $260,300. The
seasonally adjusted estimate of new houses for sale at the end
of January was 188,000. This represents a supply of 7.9
months at the current sales rate.
+++++++++++++++++++++++++++++++++++++++++++++
Mortgage Rate Update: For Month, Rates Up Again
The overall trend in mortgage rates continued to be in an
upward direction in the month of February. 30-year fixed-
rate mortgages averaged 4.95% at the end of the month
according to mortgage company Freddie Mac. The average
at the beginning of the month was 4.81%. In 15-year
fixed-rate mortgages, the average rose from 4.08% at the
beginning of February to an average of 4.22% in the period
that ended February 24th. It is important to note, however,
that both the 30-year and 15-year averages declined from
the previous week.
In the short term at least, analysts are leaning toward rates
either remaining stable or perhaps declining a bit. As always,
in volatile times such as these, it is wise to be prepared to
move should an opportunity arise.
For current average mortgage rates, see:
<A HREF="http://www.ourfamilyplace.com/homebuyer/rates.html">Mortgage Rates</A>
For an extensive discussion of all aspects of mortgages, see the section on the
site devoted to this subject. <A HREF="http://www.ourfamilyplace.com/homebuyer/mortgage.html">Mortgages</A>
++++++++++++++++++++++++++++++++++++++++++++++
Sponsor: Looking to Compare Agents? Try HomeGain.com
The most important part of your team for buying a home should be
your real estate Agent. Want to anonymously (and without obligation)
compare Agents? You can compare experience, background and
much more at HomeGain.com.
<A HREF="http://www.homegain.com/sp/ae_intro.html?entryid=2267&ht=houseclicksAE">Compare Agents</A>
++++++++++++++++++++++++++++++++++++++++++++++
This Month's Tip: Keeping it Under Control
The subtitle of this month's tip should be "Don't buy more than is
affordable." It sounds so basic, but during the big real estate run-up of
just a few years ago, it was advice that, unfortunately, millions of
people did not hear. Many of the problems that we are seeing in the
housing and mortgage markets stem from a single fact: Too many people
bought more house than they could afford. Blame has been assessed and
discussed all across the board--the purchasers, the banks, the
mortgage brokers, the builders, the appraisers--so there is no need to
discuss blame here. Rather, we think that it is more important to concentrate
on what can be done to prevent a similar situation arising from a buyer
looking to purchase a home today. The huge bonus is that with prices as
depressed as they have been in many areas, it is a golden opportunity
for the buyer.
Wants vs. Needs
One of the first culprits in the misstep of buying more house than is affordable
is the misunderstanding of the differences between what you NEED in a home and
what you WANT. Although the difference has been badly blurred in the last few
years, needs and wants are definitely not the same thing. A need is a feature
in a home that, without which, the house would not be feasible. For example,
a minimum number of bedrooms needed for a large family. Another example of
a need might be a garage large enough to store equipment necessary for a job.
A want, on the other hand, is something that while it would be nice to have
included has no real bearing on the liveability of a property. An example
here would be a stainless steel kitchen. Nice to have, but the food prepared
there would not taste any different and therefore would not be a necessity.
The easiest and quickest way to push yourself out of affordability is by
insisting on items that you would like (but truly do not need), all the
while rationalizing it with statements like "I absolutely MUST HAVE the
stainless kitchen with the granite countertops!" You don't, and if it
bumps the house out of affordability, you can't.
Following the Trend
Unlike some other investments, the trend may not be your friend. This is
another sure way to negatively impact what is affordable: Being a trend
follower. FOllowing the herd will almost always cost you extra, whether
it is the trendy home style, or neighborhood, or builder or specific
amenities. If "everyone" wants to go with the trend, it becomes, in many
cases, an issue of high demand and low supply, where even the most simple
economics demands that prices will be higher. It is also important to
consider that trends change, meaning the house you bought that had all
the trendy features may be a dinosaur 10 years later when it comes time
to sell.
Affordable Down the Line
THe housing landscape is strewn with unfortunate purchasers who bought
homes that were affordable when they moved in but which became unaffordable
at some point in the future. This often is due to one (or more) of these
factors:
+ Artificially low mortgage rates at inception that resent to higher (and
out of reach) rates. We are seeing uncountable instances of this problem
as we speak.
+ Banking on holding out until income increases enough to make the payment
affordable but the increase in earning never comes.
+ Having to deal with a big adjustment--such as a job loss or the loss of
one of the borrowers.
The more conservatively you approach your home purchase and mortgage, the
better the chance you will be able to weather potential issues down the road.
So, What IS Affordable?
Obviously, this varies a good bit from individual to individual. What makes
perfect sense for one buyer may be inadvisable for another. We have found,
though, that there are some time-tested parameters that will help to both
determine and maintain affordability.
Downpayment:
A downpayment gives you a hedge against price fluctuations but also works to
reduce your monthly payment. The more you devote to your downpayment the bigger
the rewards in safety as well as a more comfortable monthly payment. If you
cannot afford a reasonable downpayment (a minimum of 5-10% but more if at all
possible) perhaps it is a better strategy to wait a while before making a
home purchase.
Realistic Qualifying Ratios
Probably the most important determining factor in whether or not a mortgage will
be affordable to you are the qualifying ratios that the lender will develop shortly
after applying for a mortgage. These take into account your debt ratios, both with
and without your housing expense, in relation to your monthly income. Although
this can vary a bit, traditionally your monthly obligations without your mortgage
payment should be no more than 28% of your gross monthly income and your monthly
obligations with your mortgage payment should be no more than 36% of your monthly
income. Unfortunately, these ratios got pushed to the wayside in recent years and
has had much to do with people finding themselves shackled to monthly payments that
they simply cannot afford.
Avoid Non-standard Mortgages
Another big contributing factor to the housing decline were the big increases in
what can be described as "non-standard" mortgages. Included here woud be no
documentation loans (where you had to show no proof of income or expenses),
negative amortization loans (where your mortgage balance went UP every month,
even though you were making payments), "teaser rate" mortgages where you qualified
for a mortgage with an artificially low payment which then re-adjusted to a much
higher rate (and monthly payment) and loans which required absolutely no cash
down, including settlement costs. A very high percentage of the foreclosures
that are so impacting the housing industry (and dropping prices) are the result
of just these type of loans. Although these mortgages are considerably harder
to find today, they are still available and a purchaser should likely avoid them
at all costs.
Summing Up
The housing mess that we find ourselves in did not happen in a vacuum. It was
a series of mistakes and missteps by virtually everyone involved that led us
to where we are today. Had we stuck with the time-tested parameters that served
us well for decades and not thought that somehow "this time it is different,"
we very likely would not be facing the corrections we are now seeing. For an
individual home purchaser the lesson is simple: Do not make the same mistakes
that have cost others dearly.
Next Month's Tip: Common Sense Mortgages
++++++++++++++++++++++++++++++++++++++++++++++
The Home Buying Checklist
Many of our visitors have said that one of the most valuable
aspects of the Home Buyer's Information Center is the
Buying Checklist, where they can make sure that all
the bases have been touched. You can find the checklist
here: <A HREF="http://www.ourfamilyplace.com/homebuyer/checklist.html">Home Buyer's Checklist</A>
As always, if you have suggestions for improving the
site, or topics you would like to see addressed in
this newsletter (or, if you have used the Home Buyer's
Information Center to successfully purchase a home),
drop us a quick line here:
<A HREF="http://www.ourfamilyplace.com/homebuyer/feedback.html">Home Buyer's Information Center Feedback</A>
A special thanks to all those who have written to let us know
that they have found the Home Buyer's Information Center a
helpful resource in their buying process.
Have a great month and good luck in all your endeavors!
The Team at the Home Buyer's Information Center
_____________________________
Change email address / Leave mailing list: http://ymlp91.net/u.php?id=gumyqmbgsgbbmwgbb
Powered by YourMailingListProvider