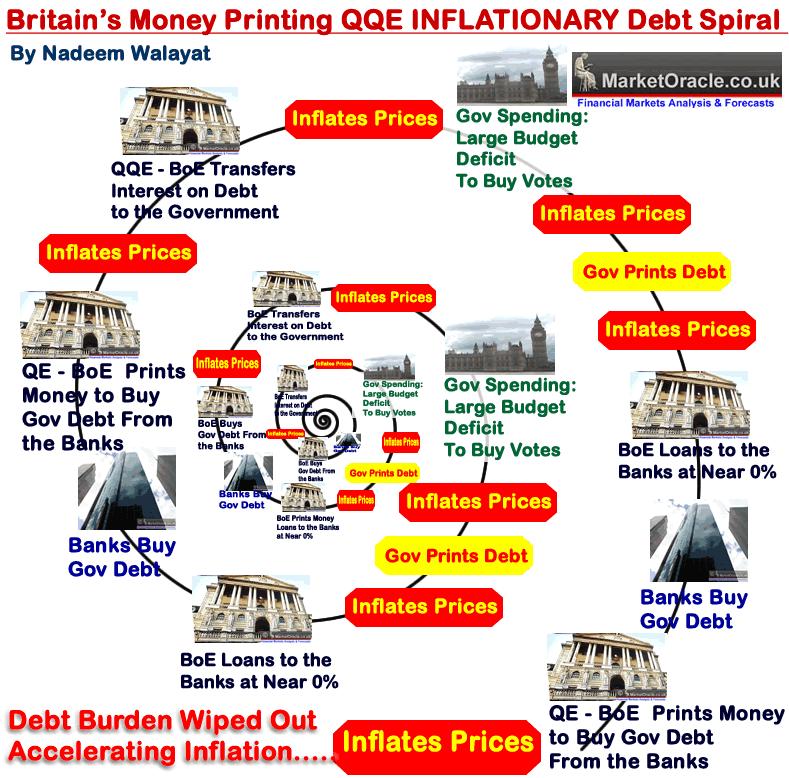
Gold Price Forecast 2013, Buying Opportunity?, is Silver Cheaper?Stocks Stealth Bull Market 2011 Ebook Direct Download Link (PDF 2.8m/b) Interest Rate Mega-Trend Ebook Direct Download Link (PDF 2.3m/b) Inflation Mega-Trend Ebook Direct Download Link (PDF 3.2m/b) Dear Reader Gold and Silver bugs have had an abysmally poor 2012 against expectations for new all time highs, where a 1 year bear market from the August 2011 high into the May 2012 low failed to spark a sustained run to new all time highs. The rally from which petered out by early October at $1800, followed by another trend back to leave Gold at $1657 as per the last close, this despite reams and reams of material plastered all over the internet that hoped for an eventual return to a gold standard or "Sound Money" as being the ultimate outcome of our ongoing global debt and money printing crisis. However, it is never going to happen, or rather not under any western style democracy, for this I don't need to indulge myself in in-depth analysis but direct readers attention to what continues to take place in the Euro-zone where the PIIGS countries having adopted pseudo sound money of the Euro have found themselves in the precise predicament of where they would be had they had a Gold standard, namely that they are unable to just print debt and money to buy votes with the stealth default consequences of inflation, whilst on the other hand we have the examples of the United States and UK that can and do print debt and money in ever expanding volume as they seek to buy up their own bonds (via central banks buying from bankrupt banks who borrow form the central banks to do so) and thus subvert the official debt to GDP ratios as I recently discussed in length (03 Dec 2012 - Bank of England Cancels Britain's Debt) with the below graph illustrating the money and debt printing / cancellation highly inflationary game that Britain is playing.
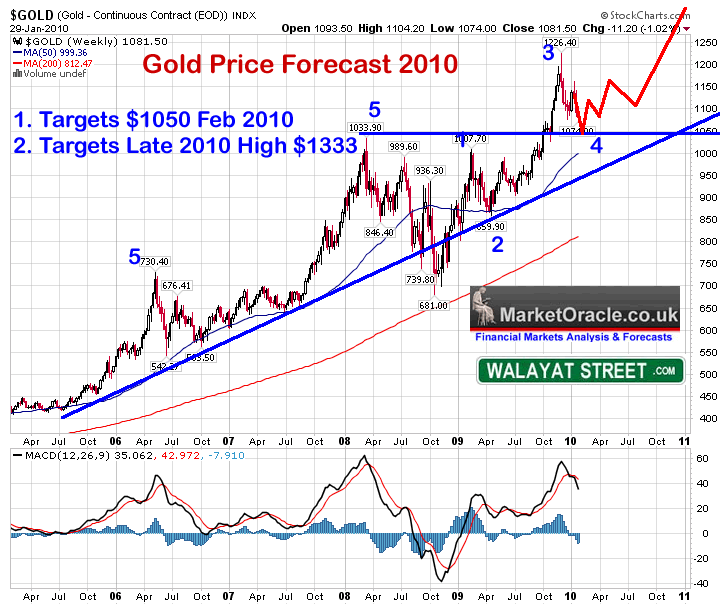
So, if you have read any of my articles over the past few years you will know that the only answer that the governments of the world have is to print money and debt to inflate the debt and liabilities away, Sound money or even pseudo sound money prevents them from doing so and therefore ensures a deflationary depression, instead we are emerged in an inflationary depression which given the real world comparisons appears to be infinitely far more palatable to the masses and therefore explains why it is every government and central banks default setting. So Gold bugs looking for sound money to turn Gold into Currency will probably find that their descendants will still be waiting a for such an outcome. Ironically, if Gold never becomes money (in our life-times anyway) it is still good news for if it were then it would probably mean that Gold's future prospects would not be as good as they are under our fiat currency money / debt printing exponential inflation inducing monetary system as governments would seek to dictate what the price of gold should be rather than the current system of manipulation of all markets to varying degrees. Now, whilst it has been been a long time since I last analysed or traded Gold and Silver. However, if you have been reading my articles you will be aware of the prevailing exponential inflation mega-trend as a consequence of government debt and money printing that continues to exert upwards pressure on asset prices and even more so when leverage is taken into account, therefore following the recent sell off in gold to $1660, a good 14% below its 2011 peak, which is perking my interest in the safe haven precious metals that this analysis seeks to resolve the probable trend for 2013. Gold Forecast 2010-2012 My last in depth analysis of Gold and Silver was several years ago at the start of November 2009 (01 Nov 2009 - Gold Bull Market Forecast 2009, 2010 Update)that was updated for the January 2010 Inflation Mega-trend ebook (Free Download). At the time Gold was trading at $1035, and the forecast for Gold was for a rally to a minimum of $1333 by late 2010 and a longer-term target of $2,000 for 2011, which is pretty much what came to pass during the next few years. Gold can expect to gyrate towards its target of $1333 by late 2010, and continue further on into 2011 as the Gold price continues to look set to trend towards $2,000 which should be easily achievable within the next 3 years.
Gold Secular Bull Market From 1980 to 1999 Gold fell for 20 years, eventually it would bottom and embark on a bull market, eventually, the signs for this would be not in fundamental data, but contained within the price chart as Gold breaks the pattern of corrective rallies followed by the downtrend resuming to new bear market lows. Some 10 years later (into mid 2011) Gold corrected the preceding secular bear market by 50% in time and well over 100% in price. The subsequent trend has seen what resembles a multi-year consolidation of that preceding bull run. Central Banks Buying Gold - For many years central banks were net sellers of gold but over the past year have been buying at the rate of about 10% of annual new supply. Though don't expect central bank buying to create a price spike as they would seek to avoid such an outcome by instead buying the dips. Global Quantitative Easing aka Money Printing Hedging We are in a new world (for the west anyway) and that is a world of Quantitative Easing, the more the governments of the world print money and monetize debt the easier it is for governments to keep printing and monetizing ever escalating amounts of government debt to cover the government budget deficit gaps. Upon which the accelerant of the Quantum of Quantitative Easing has been poured i.e. Governments paying themselves interest on monetized debt (20 Jul 2012 - The Quantum of Quantitative Easing Inflation is Coming! ) The US Fed recently revealed that its priority now is to target 6.5% Unemployment (7.7%) rather than inflation, in which respect it is engaged in a policy of QE4Ever -(01 Oct 2012 - Socialist Global Central Bank Crime Syndicate QE-4-Ever Inflation Theft) What this means is collective currency devaluation where relatively there appears to be little change in currency rates but in real terms the flood of money consequences is for upward pressure on commodity prices and other scarce resources, after all the supply of resources is mostly known and the population of the world is not decreasing so the demand is known to be on an upward curve. Therefore as long as the central bankers are embarked on escalating quantitative easing that continues to put upwards pressure under the gold price and other commodities as it increases inflation expectations and therefore inflation hedging using gold and more liquid commodities such as crude oil. Therefore in terms of Gold price action, we can expect the central banks to have effectively put a floor under the Gold price which the price charts implies is around $1550. ZIRP - Zero interest rates are likely to continue until the markets force the central banks hands, which is something that there is no sign of at this point. ZIRP is a strong positive for Gold due to negative real interest rates and therefore indicates continuing upwards pressure on Gold price for as long as ZIRP continues. Inflation Driving Gold Price?
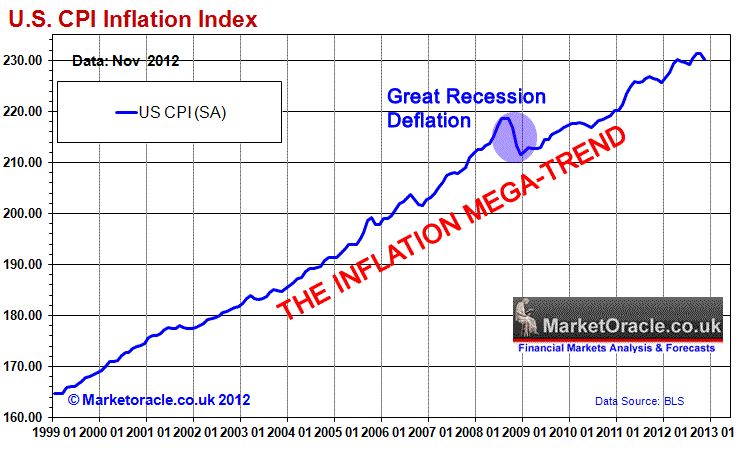
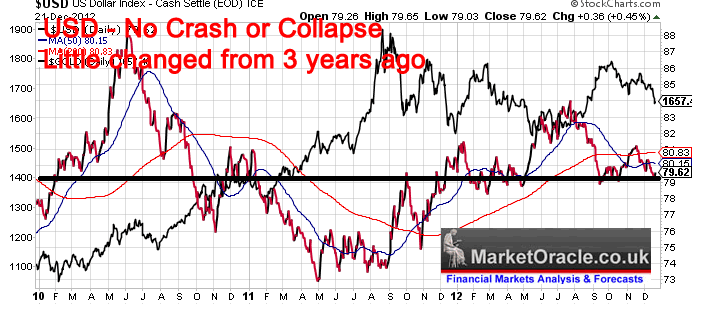
The above graph clearly illustrates that even on the official CPI inflation measure (which tends to under report real inflation), that the US is no different to any other country which contrary to the delusional deflation propaganda is instead immersed in what has always been an exponential inflation mega-trend which vested interests and what can be only termed as deflation fools have been blindly regurgitating the threats ever since the Great Recession of the 2008-2009, which the above graph clearly illustrates amounted to nothing more than a mere blip or as I warned at the time of a deflationary ripple on the surface of an ocean of Inflation. The Inflation Mega-trend Ebook of Jan 2010 (FREE DOWNLOAD), re-iterated that asset prices tend to be LEVERAGED to Inflation, which is precisely the trends that have subsequently transpired from stocks to commodities such as Gold and as I have been flagging during 2012, the housing markets, in which respect I will be taking a detailed look at the US housing market in the near future, ensure you are subscribed to my always free newsletter to get this in-depth analysis and concluding trend forecast in your email in box. However, even when taking into account Gold being leveraged to the Inflation Mega-trend, Gold rising by more than 300% over the past 10 years is well beyond the rise in CPI of 29%, so is much more a sign of a great deal of speculative interest than being driven by fundamentals. And another point for the Gold bug to consider is that in the late 1970's inflation was running at more than 10% per annum! So whilst gold has not experienced a bubble spike, however it's relentless 10 year slog higher has accumulated much speculative interest that the subsequent 1.5 year corrective trend has been seeking to unwind, which still remains well above that which pure inflation indexation would have delivered over the same time period even after allowing for leverage, so one cannot look to the ongoing inflation mega-trend to generate additional over leveraged gains, instead the same trends imply that Gold needs to further dissipate speculative interest and therefore implies a continuation for a trading range. U.S. Dollar Collapse? One of the calls for why Gold will go higher is due to a sharp drop or even collapse of the US Dollar that many proponents have been stating for over the past 3 years. However the actual dollar trend shows that the dollar is in fact little changed. This is not as a consequence of dollar strength but that all currencies are in a state of perpetual free-fall against one another that manifests itself in asset and consumer price inflation.
The chart also shows synchronicity between Gold and USD trends i.e. there are times when Gold and USD move with each other and at other times against. Current price action has both in synch in terms of trend, such cycles tend to persist for about 6 months, which implies the current phase has another 3 months to run. A quick take on the USD implies a continuing trading range. Gold Annual Percent Change
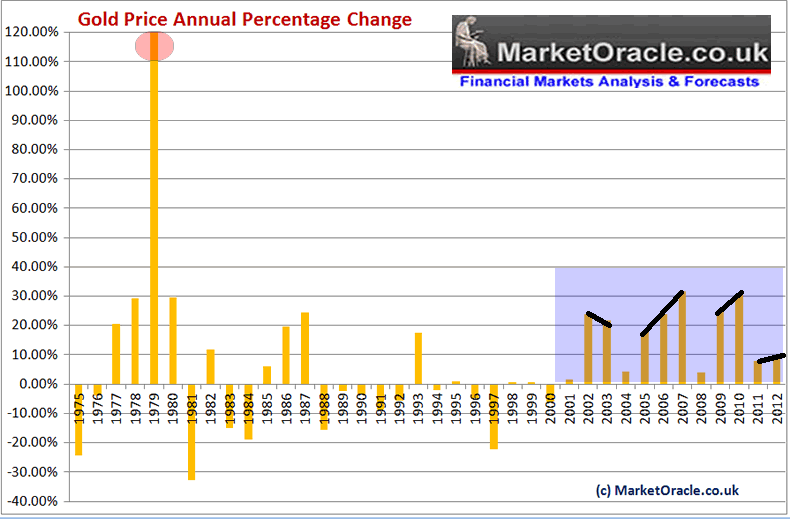
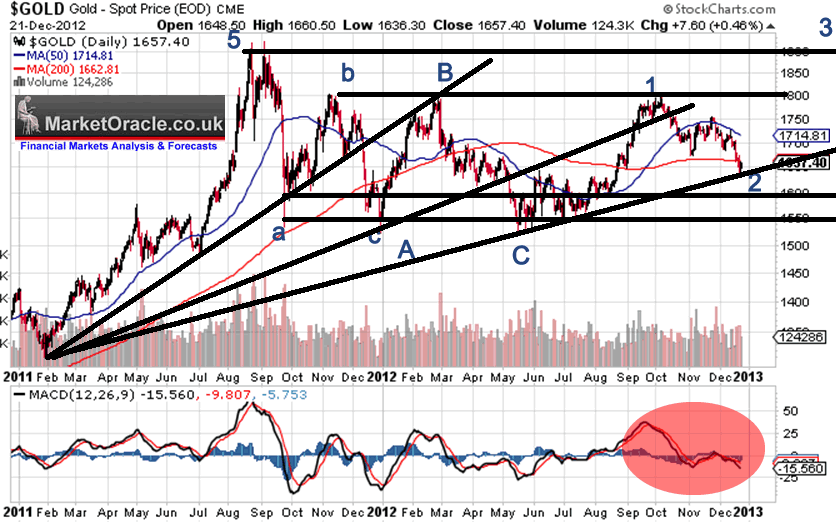
The annual % change graph further illustrates that whilst Gold has not experienced a short-term price spike along the lines of that of 1979, however one can see that it has experienced several spikes that were spread out over a number of years i.e. into 2003, 2007 and 2010. With the intra-2011 spike not registering as Gold experienced a sharp sell off into the end of that year. What does this suggest for Gold going forward ? That the best gains for the gold bull market are probably behind us, i.e. that Gold despite intra-year spikes is unlikely to experience annual gains of much more than about 10% per year with the probable range of between +4% and +10% per annum, which is the year end range one can expect for Gold for 2013, or a target price of between $1726 and $1826, which is not exactly what many gold bugs will be dreaming of i.e. a 1970's style spike for which I do not see any signs of materialising at least for several years, let alone for Gold to actually hold a break to new all time highs thus probability favours the bull market continuing at a far more subdued rate. So another warning not to get carried away by the uttering's from a long list of Gold bugs such as Marc Faber and Jim Rogers who keep banging the drums for a bubble spike that may never materialise (over the next 5 years). ELLIOTT WAVE THEORY - The elliott wave pattern implies that Gold had an ABC corrective pattern into June 2012 since which it has had an impulse wave 1, and in the midst of coming to an end of a wave 2 correction, and therefore implying that Gold is set for an Impulse wave 3 to new all time highs! i.e. the elliot wave pattern is strongly bullish, which is contrary to most of this analysis. However rather than entertaining alternative counts that will only seem probable with the benefit of hindsight, in this analysis I am discounting elliott wave as not giving me a reliable probability, the picture is just too neat, for it to actually materialise.
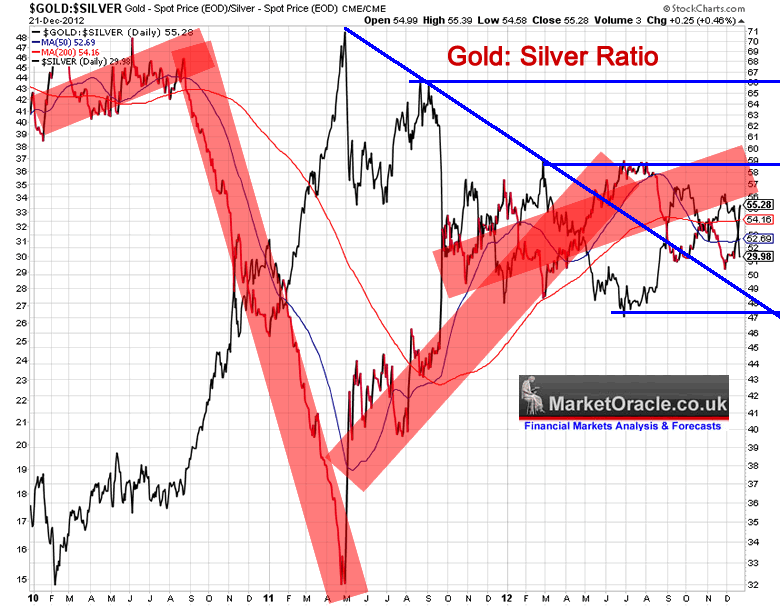
TREND ANALYSIS - Gold repeatedly failed to hold the uptrend lines which keeps resolving in breaks lower. That is the pattern that the current trend line support suggests as being most probable, i.e. an imminent bounce higher towards $1710 and then another break of the trendline support which would target a trend towards $1550. Furthermore shallow trendlines imply less volatile trends for 2013, i.e. shallow up and down trends within the prevailing range. SUPPORT / RESISTANCE - Gold is in a range trading channel, the main resistance is at $1800 and support at $1550, with a break above $1800 targeting $1900. Whilst support at $1550 looks quite strong, thus suggests a strategy of buying downtrends towards $1550 for range rallies to $1800, with potentials for a break higher that would next target resistance at $1900. Current price action in terms of the range appears to resolve towards $1550 during Q1 2013, before we can expect the next assault on $1800. However the problem with ranges is that it is difficult to determine at what point the price breaks out, and the ultimate probability is for Gold to break higher, to first $1900 and then $2000 and the longer the range goes on the harder it tends to become for the price to actually breakout and therefore more difficult to forecast. Which means given the 18 months to date, gold could stay stuck in this range for the whole of 2013. PRICE TARGETS - The immediate target is a low above $1550, the reaction from which suggests $1800. MACD - The MACD indicator is weak and showing no signs of an imminent bottom, in fact it is confirming that Gold could trend lower for at least another month into late January which would time with the probability for a continuing downtrend towards $1550 and a risk that Gold could remain weak even into late February. SEASONAL TREND - There is a strong seasonal tendency for gold to rally from November through January, however Gold is clearly not following the seasonal trend which implies inverse expectations. Therefore a weak Jan, Feb and stronger March and April. Gold - Silver Ratio - Which is Cheaper? On face value the gold-silver ratio chart implies that Silver is cheap. BUT Silver is heavily dependant upon sentiment, i.e. it needs a strong trend for gain against Gold. Whilst in a shallow trend or a trading range will continue to see silver increasingly lag behind Gold, which means that whilst Silver is cheaper than Gold, given expectations for a continuation of the Trading range, silver could yet get even cheaper relative to Gold i.e. as was the case during the first half of 2010.
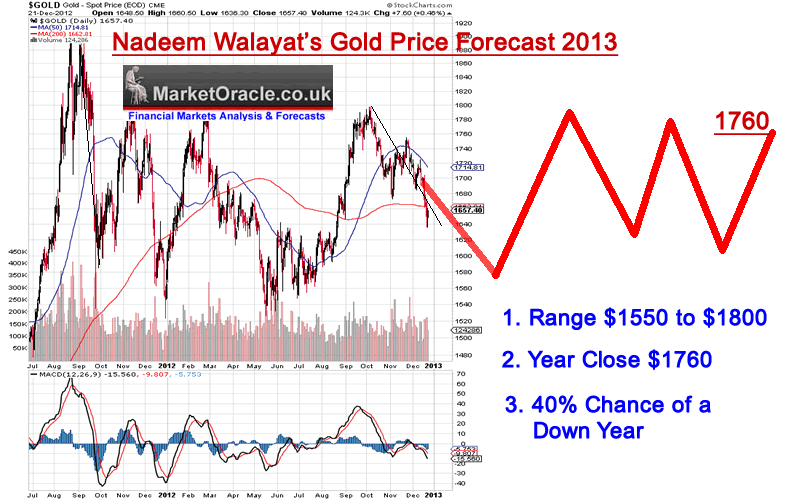
However should Gold breakout higher above $1800 we will see Silver start to significantly outperform, so I will definitely be keeping an eye on silver especially near Gold lows of $1550 as it would be trading at deeper discount. Gold Risks of a Down Year Gold has not had a down year for 12 years! Add to that expectations of a trading range of 1800 to 1550. Throw in a close of $1660, and annual volatility of 20% and then that implies a 40% risk of a down year, i.e. a close below $1660, which could yet worsen if Gold rallies into the end of the year i.e. Gold closing the year at say $1710 would imply a 60% chance of a down year, whilst a close at $1600 would imply just a 20% risk of a down year. Gold Price Forecast ConclusionThe bottom line is that whilst the Gold bull market will likely continue until ZIRP ends, however Gold bugs are not going to like hearing that the best years of gains are now probably behind gold, and that the best they can expect to achieve is gains of about 10% per annum as Gold is now in a mature bull market. Therefore my analysis resolves to the following key conclusions for 2013 - 1. That Gold looks set to trade within a range for most of the year of between $1550 and $1800. 2. That Gold should trend higher towards the end of the year with overall probability targeting a year end close in the region of $1760, which on the last close of $1660 implies a gain of about 6%, with a 40% risk of a small down close year i.e. between $1659 and $1550. The below graph better illustrates how the Gold price could trend during the year.
The risks to the forecast are that the Gold price breaks higher to first target $1900.
I will be adopting two potential strategies. 1. I will eye accumulating Gold when it is sub $1580 for long-term investments, probably upto 6% of total portfolio (Gold and Silver). Silver offers the better long-term opportunity in terms of risk vs reward off of the lows due to expectations for a deeper discount and greater long-term potential. 2. I will attempt to trade the range when opportunities arise i.e. buy off of $1550 triggers and exit from $1800 triggers. With the risk of an ultimate breakout higher I will refrain from trading the short-side. Also remember trading commodities is extreme high risk! Ensure you remain subscribed to my always free newsletter to get my next in-depth analysis and concluding trend forecast. Source and Comments: http://www.marketoracle.co.uk/Article38201.html Happy Holidays & a Prosperous New Year By Nadeem Walayat Copyright © 2005-2012 Marketoracle.co.uk (Market Oracle Ltd). All rights reserved. Nadeem Walayat has over 25 years experience of trading derivatives, portfolio management and analysing the financial markets, including one of few who both anticipated and Beat the 1987 Crash. Nadeem's forward looking analysis focuses on UK inflation, economy, interest rates and housing market. He is the author of three ebook's - The Inflation Mega-Trend; The Interest Rate Mega-Trend and The Stocks Stealth Bull Market Update 2011 that can be downloaded for Free.
Nadeem is the Editor of The Market Oracle, a FREE Daily Financial Markets Analysis & Forecasting online publication that presents in-depth analysis from over 600 experienced analysts on a range of views of the probable direction of the financial markets, thus enabling our readers to arrive at an informed opinion on future market direction. http://www.marketoracle.co.uk Disclaimer: The above is a matter of opinion provided for general information purposes only and is not intended as investment advice. Information and analysis above are derived from sources and utilising methods believed to be reliable, but we cannot accept responsibility for any trading losses you may incur as a result of this analysis. Individuals should consult with their personal financial advisors before engaging in any trading activities.
You're receiving this Email because you've registered with our website. How to Subscribe Click here to register and get our FREE Newsletter To access the Newsletter archive this link Forward a Message to Someone this link To update your preferences this link How to Unsubscribe - this link
The Market Oracle is a FREE Financial Markets Forecasting & Analysis Newsletter and online publication. | ||||||||||||||

Tuesday 25 December 2012
Gold Price Forecast 2013, Buying Opportunity?, is Silver Cheaper?
Thursday 13 December 2012
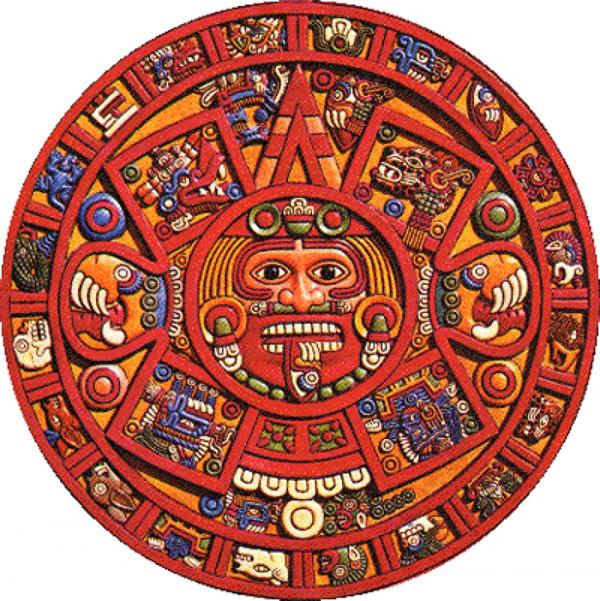
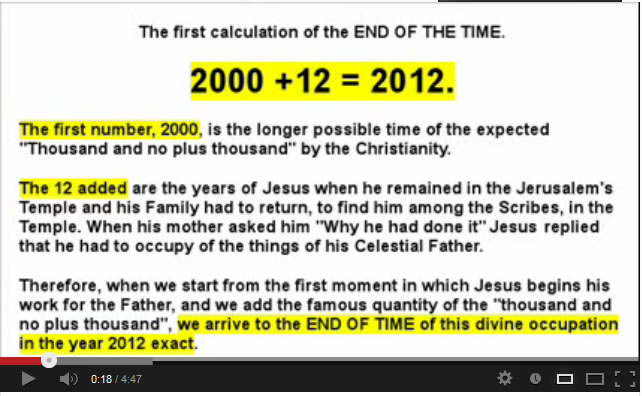
Mayan End of the World 2012 Prophecy
Mayan End of the World 2012 ProphecyStocks Stealth Bull Market 2011 Ebook Direct Download Link (PDF 2.8m/b) Interest Rate Mega-Trend Ebook Direct Download Link (PDF 2.3m/b) Inflation Mega-Trend Ebook Direct Download Link (PDF 3.2m/b) Dear Reader The world will end on 21st December! Or so the Mayan calendar supposedly predicts, though is vague on what the actual mechanism for our extinction will be, with the hot money betting on being hit by a rogue planet called Nibiru, whilst many academics argue that the Mayan calendar actually does not predict that the end of world but the end of one cycle and the beginning of another. However these theories have not filtered through to the masses many thousands of miles away in places such as China where some are going so far as building arks to ride out the end of the world, in Russia selling doomsday kits, in France closing access to mountain passes to avoid panic amongst people fleeing to the mountains.
It is no wonder that a mini-mania exists for a look at Amazon shows over 60 books written on the prophecy and probably a similar number of films and documentaries produced on the subject, most notable of which is the 2009 hollywood movie named '2012' that in graphic style promoted the break-up of the earths continental crust and not to mention the tens of thousands of youtube videos on the subject, even NASA has jumped onto the bandwagon by seeking to debunk the various scenarios. NASA - Skeptic Whilst the mania is not on the same scale as that which accompanied the millennium (2000) but it is enough to increasingly grip many people and the media as the world counts down to December 21st. Religion - End of the World Confirmed by Jesus!
On a serious note, the Mayan prophecy illustrates that virtually all religions have an 'End of the World' event built into their script as a means of fulfilling the prophecy of rewarding all of it's followers and as a warning of the consequences to those who have deviated from their respective paths. Why Did Humans Evolve Religion? For religion is clearly an evolutionary development because all societies from before the dawn of history have had a desire for religious belief. The traditional answer is that humans evolved religion as a means of coping with death of loved ones, which is true, as religion preys strongly on personal crisis in helping cope with the deaths of loved ones by promising that they will see their loved ones again. Another reason often put forward is for a means of explaining the world around us as being created by an all powerful deity, because it was only until quite recently that we have had any real clue as to the nature of the forces at work around us that have crafted our environment and state of existence. However, whilst both are important elements of why humanity evolved God and religion, they do not explain the primary purpose of religion and why religions have evolved into the multi-million and even multi-billion user corporate entities, with their respective user manuals, logo's and ever expanding associated paraphernalia. The Primary Reason Why Humanity Evolved Religion For tens if not hundreds of thousands of years humans (homo-sapians) lived in relatively small groups of constantly on the move hunter gathers that numbered no more than a couple of hundred people at most, and these groups tended to be dominated by a single Alpha male who would be the strongest, best warrior / fighter and hunter of the group, the Chief of the tribe who would be responsible for most of the groups offspring, which is what evolution dictates would happen for the survival of the fittest to take place. However, as humans discovered agriculture and started to settled down, then populations tended to grow far beyond the small hunter gatherer groups, which means that the tribes started to produce far more competing alpha males than used to be case that would result in much conflict within the groups and act as a limiting factor for growth of settlements as they would tend to continuously break into smaller groups each led by an alpha male. It took until human societies started to independently evolve religious ideas as a means of CONTROLING the behaviour of members of society, namely the alpha males such as that of rules of how people should behave that were said to be laid down by an all knowing and powerful deity, the creator, rules such as thou shall not kill, steal, and one man one wife, and off course to pay homage to the creator and follow the teachings and instructions of the deities prophets and priests, that were to be repeatedly recited and ingrained in all members of society, with similar universal rules emerging across all surviving societies, allowing them to expand as religious ideas of control spread to all those settlements that had yet to evolve means of religious control. All religion's seek to exert total control over every member of society as it was/is believed that all events that happen are as a consequence of the pleasure or displeasure of the Gods such as natural disasters in which respect societies even went so far as to sacrifice fellow humans to please their gods, and sacrifice remains at the fundamental core of all religions i.e. that humans sacrifice independant free will in this life for freedom in the next life, and to a achieve entry into the afterlife humans need to obey the will of the Gods as set down by those that purport to represent the deities such as Emperors, Kings & Queens and Priests under the fear of what would happen to them if they did now obey the will of the Gods as iterated by their representatives on earth. This trend took place over tens of thousands of years, long before the Egyptian Pharos first appeared on the scene, and as we see in history that religions have gone through many innovations over the subsequent thousands of years, where each religion built upon what went before it, incorporating technologically advancements as a consequence of the increase in the size of populations as larger settlements become more productive in terms of food production, industry (tradable goods) and innovation, with the greatest innovation of all being the written alphabet by the Phoenicians that emerged some 4000 years ago and that literally lit the fuse under all religions as it that allowed religious ideas to spread far more rapidly and in ever greater intensity than was ever possible during the preceding 50,000 years where religions went on to document the word of god in a series of books. Complete religious control even upto the point of self sacrifice (martyrdom) went hand in hand with expansion of the size of societies with many tweaks along the way that allowed some religions to better able to compete against other religions such as Judaism innovation of there being one God, rather than many gods that tended to be the norm some 2000-3000 years ago, which was followed by the next big innovation of Christianity that promised life after death for all and that anyone could become a Christian, which allowed it over the next 400 years to go from an small persecuted Jewish sect to replace all of the myriad of gods of the Roman Empire as the ultimate means of the lever for control by the Elite over the tens of millions of Roman citizens. Which eventually itself was challenged by the next great innovation that was Islam that presented it's followers with an even more unified highly ritualistic way of life and accompanied by just as dire consequences for those that did not follow Islam's teachings. Obeying a Societies Elite is Genetic - We are Born Followers! The larger a society becomes the more intense the unifying rules and rituals become that aim to break down the ethnic and tribal barriers between peoples of a society, where for much of civilisations march though time it has been the prevailing belief that mans every actions are being constantly monitored by an all knowing, and infinitely powerful deity who will pass judgement on the day the world ends. God and religion are an evolutionary survival mechanism which is why we are where we are today, for without god and religion we would never have progressed beyond the small hunter gather groups dominated by single Alpha males that is the case with the Great Apes today and can be seen in recently discovered isolated rain forest tribes who have literally stood still for tens of thousands of years due to failure to make the religious leap that allows groups of greater size than that controlled by a single Alpha male. We have seen this in built tendency in all human societies, we have seen this in large empires such as the Soviet Union, and Communist China, that whilst officially stating themselves to be atheist, never-the-less still created their own religions around their prophets such as Lenin and Mae Tse Tung, and then utilised state security apparatus to perpetuate the threat and fear of an the all seeing and knowing state that knew of the general populations every actions so demanded complete obedience. Over time this control of the masses through technology has continued to develop and intensify the hold on the general population's actions, making it far easier for the elite to control every aspect of life through monetary mechanisms namely such as debt, as God in the West has gradually given way to the all seeing and knowing power of the Elite controlled State. In today's society we are manipulated from cradle to grave by the state to serve the interests of the elite, we are educated to be docile citizens that will go on and work for the elite, to perform all of the duties that the elite request of us for pieces of paper.We are forced to work for the state for 1/3rd of our working life is spent paying taxes. We are forced to work for the elite as 1/3rd of our working life is spent servicing our debts. We are constantly being bombarded with propaganda to be good citizens or face the dire consequences, because our every action is being watched and monitored 24/7 by technology from millions of CCTV cameras, internet browsing logs, phone conversation, mobile phone networks, GPS positioning, financial card transactions, and in your every interaction with the state's apparatus and private corporations that is logged and which the state has constant access to determine whether our behaviour is subversive or not. And it won't be many more years before people are convinced that it is good to have chips implanted directly in our heads under the guise of the benefits of augmented reality, heads up information displays overlaying the real world, so that a persons every action and ultimately thoughts will be recorded and monitored, so as to reinforce the idea of only thinking good thoughts that the State / elite wants you to think else you will be subject to the wrath of the all powerful state's thought police. The only mechanism people actually have to see through the propaganda and the means of control, is pain, be it physical pain or financial pain, which is usually why those that experience pain tend to rebel against the elite, which is why the elite / State either tends to inflict severe pain on some sectors of society as a warning to the rest (i.e. Jews in 1930's Germany, Gazans 2012 Palestine) so that fear motivates compliance from the rest, or the elite buys the compliance of the masses by means of printing money coupled with all pervading economic propaganda such as 2% Inflation is good that results in an stealth inflation theft of wealth and purchasing power and thus the independence of ordinary people for inflation benefits the state and the elite and not the masses who become reliant on state handouts to fill the ever widening gap between rising prices and earnings. Economics is the Religion of Today's Political High Priests Economics is a form of religion, a means for controlling the masses, the fact that it is difficult for most people to recognise this despite the fact that economists have time and time again proven to be near 90% wrong, illustrates how successful economics is as a tool for state propaganda as the State continues to print money in its various forms such as debt to maintain its power over people. Know this the cause of inflation is pure and simple government money printing that benefits those that are leveraged to inflation i.e. the elite who own the means of production and assets. The only mechanism that humans have for seeing through the propaganda is to experience PAIN and REWARD, which is something that vested interest academic economists and pseudo economists in the mainstream press rarely tend to experience as a consequence of another evolutionary development which is that people tend to easily forget when people are wrong if they experience little pain to imprint those memories. Therefore people need to recognise a fundamental fact that as humans we are very easily susceptible towards being controlled by the state / elite because it is an evolutionary development and therefore it is hard wired in our genes. We have evolved into easily controllable individuals so that societies could be built in size that go far beyond the small hunter gather tribes as mentioned earlier. The Problem with Evolving Religion Whilst the God / religion evolutionary adaptation has in large part proved highly successful as illustrated by how far humans have progressed in full filling the primary purpose of life which is to spread. However as we have seen numerous times in history it can also go horribly wrong, such as Nazi Germany as the elite use fear to control the actions of people to their bidding. The logical answer is for humans to evolve beyond the current prevailing set of religious beliefs that imply doomsday is inevitable, as illustrated by today's obsession with the Mayan Prophecy, this despite the fact that the Mayan religious doctrine went extinct over a thousand years ago as Mayan peasant slaves saw through the smoke and mirrors of the Mayan elite and rebelled. As ultimately technology will at some point allow religious fanatics of whatever persuasion to manifest the doomsday that they so ardently await as prophesied by all religions. The Future Humanity is clearly starting to evolve out of a requirement for doomsday cults, which means traditional religions based on thousands of year old ideologies are increasingly likely to diminish in influence. However ultimately this also means that human's will complete the evolutionary transition towards the manifestation of every action and thought being monitored and known to an all powerful state. To those reading this today this may sound like a science fiction fantasy but this is how God will be replaced by technology, as technology fulfills what is written in our genes, as such a situation will not be something that is outside of human experience but actually mark a continuation of human evolution towards being able to create ever larger and more unified societies far removed from cultural and ethnic differences towards which evolution has been pushing mankind towards for tens of thousands of years. The Day After - December 22nd I think most reading this will agree that the Mayan end of the world calendar will pass without event, towards which the response of vested interests (book writers and religious fanatics) will be just as every response has been following such events which is to reinvent history and say that it meant something totally different, i.e. the beginnings of a new cycle, transformation of the world into ... what ? And thus there will be a need for many more Mayan books to be written and sold that will imply that the Mayan calendar really meant that the world would end not this month but many centuries from now as the religiously motivated crave the next end of the world myth to focus upon and some even contemplating ways of manifesting it so that they can achieve their rapture. Source and Comments: http://www.marketoracle.co.uk/Article38020.html By Nadeem Walayat Copyright © 2005-2012 Marketoracle.co.uk (Market Oracle Ltd). All rights reserved. Nadeem Walayat has over 25 years experience of trading derivatives, portfolio management and analysing the financial markets, including one of few who both anticipated and Beat the 1987 Crash. Nadeem's forward looking analysis focuses on UK inflation, economy, interest rates and housing market. He is the author of three ebook's - The Inflation Mega-Trend; The Interest Rate Mega-Trend and The Stocks Stealth Bull Market Update 2011 that can be downloaded for Free.
Nadeem is the Editor of The Market Oracle, a FREE Daily Financial Markets Analysis & Forecasting online publication that presents in-depth analysis from over 600 experienced analysts on a range of views of the probable direction of the financial markets, thus enabling our readers to arrive at an informed opinion on future market direction. http://www.marketoracle.co.uk Disclaimer: The above is a matter of opinion provided for general information purposes only and is not intended as investment advice. Information and analysis above are derived from sources and utilising methods believed to be reliable, but we cannot accept responsibility for any trading losses you may incur as a result of this analysis. Individuals should consult with their personal financial advisors before engaging in any trading activities.
You're receiving this Email because you've registered with our website. How to Subscribe Click here to register and get our FREE Newsletter To access the Newsletter archive this link Forward a Message to Someone this link To update your preferences this link How to Unsubscribe - this link
The Market Oracle is a FREE Financial Markets Forecasting & Analysis Newsletter and online publication. | ||||||||||||||

Monday 3 December 2012
Bank of England Cancels Britain's Debt, Coalition Government Budget Deficit Crisis is Pure Propaganda
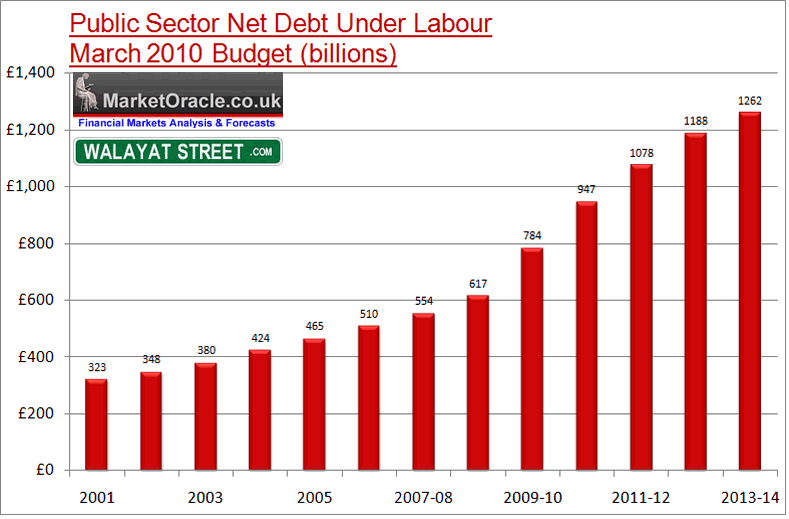
Bank of England Cancels Britain's Debt, Budget Deficit Crisis is Pure PropagandaStocks Stealth Bull Market 2011 Ebook Direct Download Link (PDF 2.8m/b) Interest Rate Mega-Trend Ebook Direct Download Link (PDF 2.3m/b) Inflation Mega-Trend Ebook Direct Download Link (PDF 3.2m/b) Dear Reader The focus of this article is on Britains debt dynamics as the people of Britain continue to be bombarded with propaganda in respect of the unfolding Inflationary Depression that the country has been immersed in since at least early 2008. In terms of politics, propaganda takes the form of declarations for ever greater needs for economic austerity by the Coalition government whilst the Labour party as usual takes the opposite line, when the reality is that there has been no real net economic austerity in Britain, as there has been no cut in government spending and hence the deficit continues to persist let alone any actual repayment of debt that continues to expand by about £120 billion per year. Meanwhile the Bank of England continues to play its role in the economic propaganda war by playing the always imminent deflation card that is regurgitated at length by academics and pseudo economists in the mainstream press when the reality is that the UK as is the case for most western nations such as the US is immersed in an exponential inflation mage-trend that results in the stealth theft of wealth to finance government spending for the purpose of buying votes. Britain's Economic Austerity / Debt / Deficit Reduction Propaganda The Coalition Government as illustrated by the Prime Minister, David Cameron's series of speeches re-iterating the UK governments efforts towards cutting the governments budget deficit, and actual repayment of debt before the end of this parliament (2015) for which there is an ever present need for economic austerity which translates into deep cuts in government spending - David Cameron - 10th October 2012
Fact - No Debt has been repaid, Instead UK government debt continues to accumulate at the SAME rate as it would have done under a Labour government.
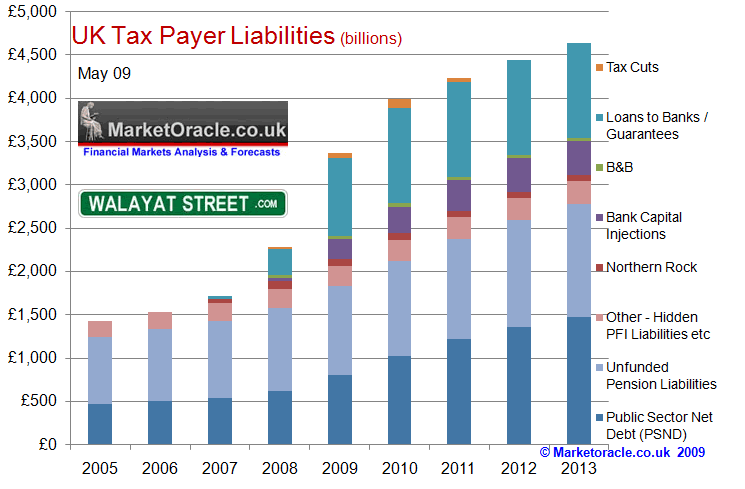
Of course total government debt is actually over X4 higher then official public debt at about £4.8 trillion for 2012-13, which is set against my forecast of May 2009 of £4.7 trillion for 2013.
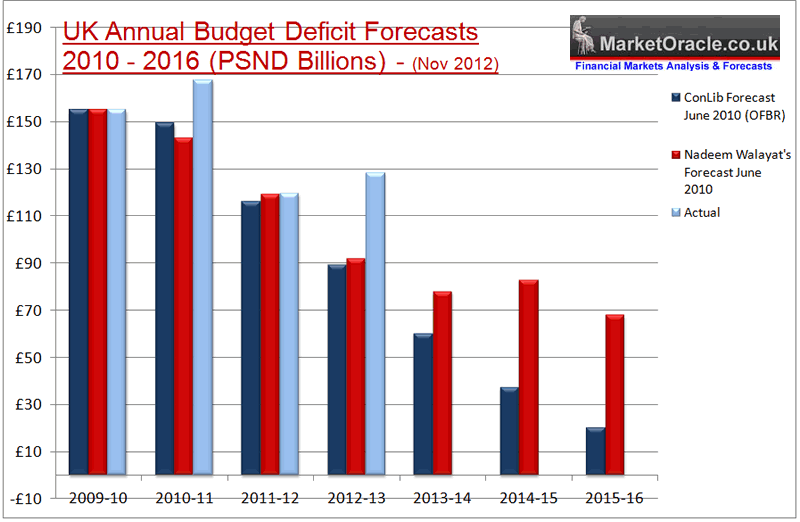
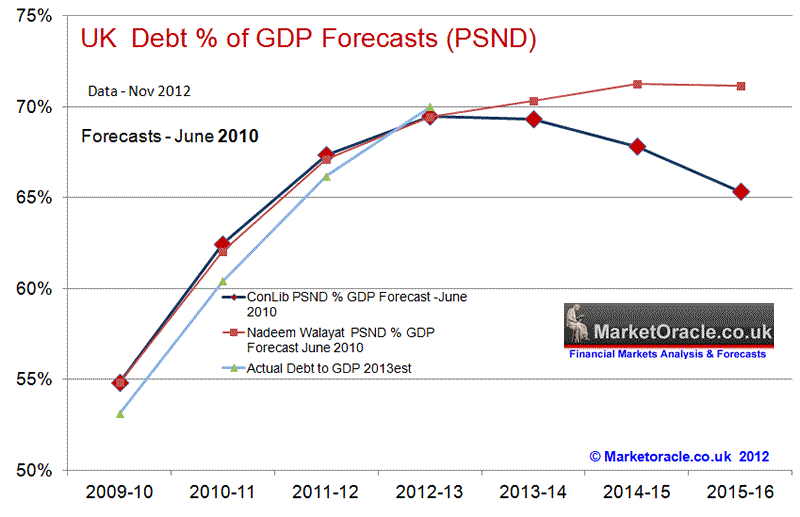
In additional to public debt and liabilities there is also private sector debt of banks, corporations and individuals that is estimated to be between £6 to £8 trillion, given the fact that the bankrupt banks alone are still sitting on approx £4 trillion of debt, thus total UK debt is estimated to be between £11 and £13 trillion. Is the Coalition Government Cutting the Deficit as It repeatedly States? With the focus on official government debt (PSND) i.e. excluding the £1 trillion banking sector bailout, the below updated graph illustrates how the annual deficits are turning out when set against the Governments own forecast of June 2010 (OBR), and similarly my forecast of the same month (UK ConLib Government to Use INFLATION Stealth Tax to Erode Value of Public Debt )
What the graph clearly shows that the UK government has once more LOST control of the budget deficit, because instead of the deficit falling to around £90 billion for 2012-13, the government will be luckily if the deficit comes in under £130 billion. Furthermore this trend for expanding deficits is expected to persist going into the May 2015 election as the Coalition government ramps up government spending to buy votes, therefore there is a high probability that the deficit could yet expand further, the net effect would be for a total accumulative additional budget deficit of well over £200 billion more than government expectations. UK Debt to GDP Ratio The following graph illustrates the difference between the Government's Debt to GDP trend expectations and the real debt dynamic reality (excluding bank bailouts) of out of control budget deficit, the government forecast, and my original expectations of June 2010.
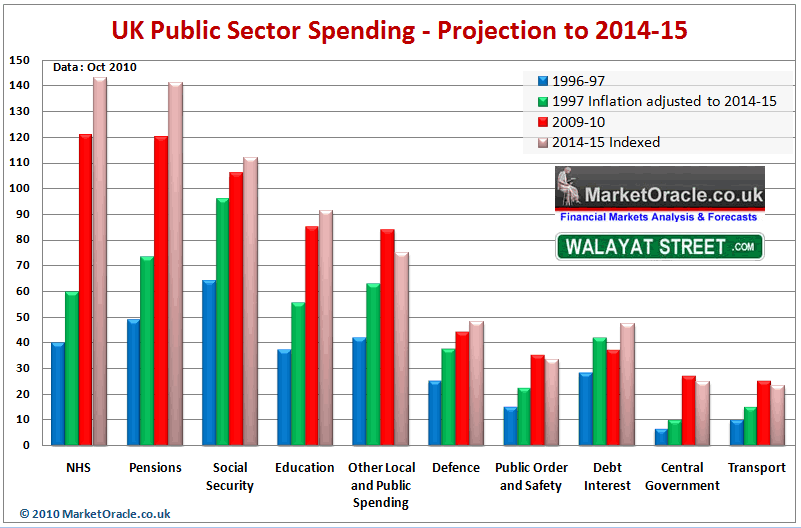
The graph has been updated to show my expectations for Debt to GDP to rise to 79% by 2015-16 as a consequence of persistently high budget deficits that look set to average £110 billion per year, instead of £80 billion per year. Government Spending - The NHS is Bankrupting Britain The government is set to spend an estimated £683 billion for the current financial year 2012-13, that is currently running an ANNUAL £128 billion deficit, i.e. the government will this year spend £128 billion more than it earns in revenue which is contributing to towards Britains inflationary depression. My analysis of October 2010 (UK Public Sector Spending Cuts Impact on Deficit, Debt, Unemployment and Economy)forecast that government spending would continue to grow to £739 billion by May 2015 and so far the Government in the preceding TWO years has done nothing in terms of cutting government spending to alter this trend trajectory despite all of the cuts propaganda to date.
The NHS is the Governments largest departmental expenditure, for instance NHS spending now stands at £127 billion (2012-13) and remains on target to expand to at least 140 billion for 2014-15. The NHS budget under Labour had grown from £40 billion in 1997 to £120 billion by the time of the 2010 General Election. NHS budgets increasing in line with inflation (CPI) would have seen the budget rise to stand at £51.6 billion, and probably nearer £60 billion to allow for an ageing population. So the Labour government in effect spent an extra £60 billion a year. Against this extra spending instead of Briton's experiencing the health benefits of effectively paying for TWO NHS's, the NHS has experienced year in year out loss in productivity, i.e. the more the government spends on the NHS the LESS output the NHS delivers as more tax payer funds disappear into the NHS black hole. In theory this suggests that the NHS budget could in-effect be halved to back towards £60 billion and still deliver a functional health service that the country could actually afford. Off course that is not going to happen, but still a mere 10% cut in the NHS budget would contribute some £12 billion of annual savings from what amounts to an out of control spending black hole that like a cancer is eating away at the British economy. However, both major political parties stubbornly stick to the policy of not only not cutting spending on the largest spending departments of Education or the NHS but seeking to continue to GROW these budgets over the coming years. Similarly both parties have pledged to grow pensions and neither can I see how welfare can be significantly cut as unemployed will remain unemployed until they get a job. Furthermore debt interest at £50 billion per year is expected to continue to grow inline with each month the government racks up another large deficit, which therefore adds to the annual government spending totals. Government spending at approx 20% more than revenue (£128bn/ £383bn) continues to represent out of control spending that risks severe consequences, including state bankruptcy i.e. debt default. In response to this politicians of all parties continue to lie for the duration of the current parliament by repeatedly failing to identify where and how this deficit will actually be cut. NHS GP Doctors Putting Profit Before Patient Care, Channel 4 News InvestigationDuring 2011 a Channel 4 News investigation illustrated Coalition Government incompetence by charging NHS Doctors with the subversion of the the coalitions governments NHS reforms to result in NHS doctors pocketing all of the cash saved as a consequence of the reforms, which matched my own analysis of a year earlier that the Coalition Governments proposed reforms were fatally flawed in that they allowed GP's to profit from patient care. "Your doctor making a profit out of your health care, your GP Sending you to a clinic that he or she owns shares in, we are seeing the biggest shake up of the NHS in its history, Channel 4 news can reveal tonight that there is nothing on the legislation currently before parliament to prevent the outcome no one wants, doctors putting profit before the care of patients, in our special report tonight we show how the new arrangements will create fundamental conflicts of interest potentially harming the trust at the very heart of the doctor patient relationship". Channel 4 News Channel 4 News investigation key points:
Under the previous Labour government patients were treated as credit cards to swipe in and out of door ways as fast as possible to maximise profits. Under the Coalition government patients will now become cash cows to milk to the fullest extent possible, what's best for the health of patients won't even factor into the thought process during GP consultations - "If I send Patient X to Clinic Y for Operation Z, my consortia will earn a commission of £2,000". Sheffield NHS GP Consortia's Example The city of Sheffield illustrates how the implementation of Coalition government reforms is proving to result in the exact opposite anti-competitive consortia's, as virtually all of the Sheffield NHS 92 GP Practices have signed up with one of of 4 geographically located GP Consortia's.
The NHS GP reforms being implemented are pushing towards the worst of both worlds, i.e. no market competition and unprecedented GP control over NHS funds that in significant part will be funneled into the back pockets of NHS GP's via Consortia profits being paid out as dividend's to GP partners and eventual huge windfall profits of several million pounds per GP as consortia's are floated onto the stock market. Public Sector Noose Tightens Around UK Economies Neck The Public sector comprises some 50% of the economy that acts as a noose around the economy that strangles competitive industries and entrepreneurship, because one cannot compete against subsidised public sector services that exist purely to accumulate debt. Many may argue the case for economic austerity reducing the size of the public sector, however all that has happened is that services have been slashed in an attempt to retain as many of the public sector jobs as possible, thus leaving diminished funds for actual front line services. The Perpetual Debt Inflation Based Economy The only answer / solution that governments have remains as I have iterated many times over the past few years, that for the stealth default by means of high real inflation, and hence the Inflation Mega-trend. Inflation is a REQUIREMENT for the Debt Based Economy, this is how governments keep putting off the day of reckoning by inflating the debt away and then borrowing more money to service the debt interest which is why virtually all money in an economy is debt money that will NEVER be repaid. When George Osbourne and David Cameron are telling you that they are paying down Britain's debt, they are LIEING! NO GOVERNMENT DEBT IS BEING REPAID OR WILL EVER BE REPAID! You should by now be realising that the over-whelming commentary about the threats and risks of debt deflation are nothing more than propaganda so as to allow policies such as quantitative easing (money printing) to be more palatable to the general populations so as to ensure that the Inflation Mega-trend continues, therefore a good 90% of what you read in the mainstream press which is regurgitated by the blogosfear is pure propaganda. The Quantum of Quantitative Easing It is time for another one of my Red pills (your choice), but be warned this time I am going to take you even further down the rabbit hole than is usually the case.
This is where we once more leave behind academic analysis of UK debt that the mainstream financial press and which government propaganda / politicians focus upon, but instead take a look at what is really going on with regards Britain's debt dynamics, because the picture we get is very different to the one I have just extensively painted above when we bring what I termed as the Quantum of Quantitative easing into the picture ( 20 Jul 2012 - The Quantum of Quantitative Easing Inflation is Coming! ). What is the Quantum of Quantitative Easing (QQE) ? First a reminder of QE, to date the Bank of England has officially printed QE of £375 billion, plus another £80 billion that goes by the name of funding for lending, plus at least another £50 billion of behind the scenes off balance sheets loans to the Bankrupt banks that date back to as long ago as April 2008 that are continuously rolled over which means that the total QE is at least £505 billion of which approx 75% is being utilised to to buy UK government bonds. My article of July 2012 explained that QQE amounts to the effective cancellation of government debt as the Bank of England repays the interest received on the debt held by the Bank of England back to the government..... By Nadeem Walayat Copyright © 2005-2012 Marketoracle.co.uk (Market Oracle Ltd). All rights reserved. Nadeem Walayat has over 25 years experience of trading derivatives, portfolio management and analysing the financial markets, including one of few who both anticipated and Beat the 1987 Crash. Nadeem's forward looking analysis focuses on UK inflation, economy, interest rates and housing market. He is the author of three ebook's - The Inflation Mega-Trend; The Interest Rate Mega-Trend and The Stocks Stealth Bull Market Update 2011 that can be downloaded for Free.
Nadeem is the Editor of The Market Oracle, a FREE Daily Financial Markets Analysis & Forecasting online publication that presents in-depth analysis from over 600 experienced analysts on a range of views of the probable direction of the financial markets, thus enabling our readers to arrive at an informed opinion on future market direction. http://www.marketoracle.co.uk Disclaimer: The above is a matter of opinion provided for general information purposes only and is not intended as investment advice. Information and analysis above are derived from sources and utilising methods believed to be reliable, but we cannot accept responsibility for any trading losses you may incur as a result of this analysis. Individuals should consult with their personal financial advisors before engaging in any trading activities.
You're receiving this Email because you've registered with our website. How to Subscribe Click here to register and get our FREE Newsletter To access the Newsletter archive this link Forward a Message to Someone this link To update your preferences this link How to Unsubscribe - this link
The Market Oracle is a FREE Financial Markets Forecasting & Analysis Newsletter and online publication. | ||||||||||||||

Sunday 25 November 2012
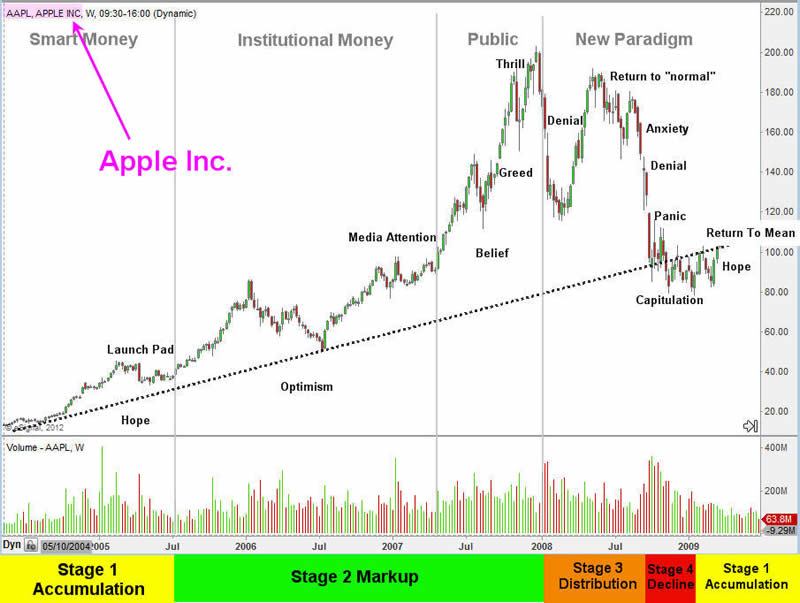
Apple, How Market Booms Turn to Busts, Trading From New Paradigm to Despair
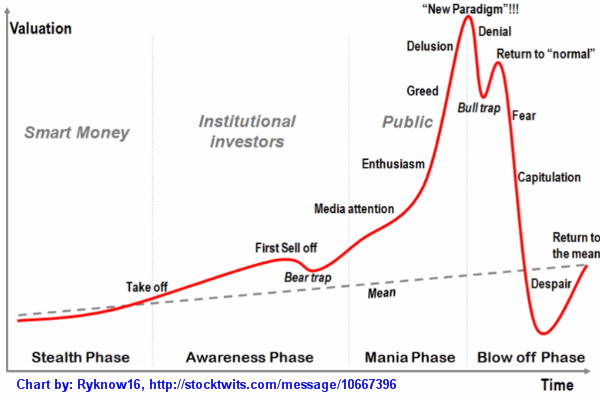
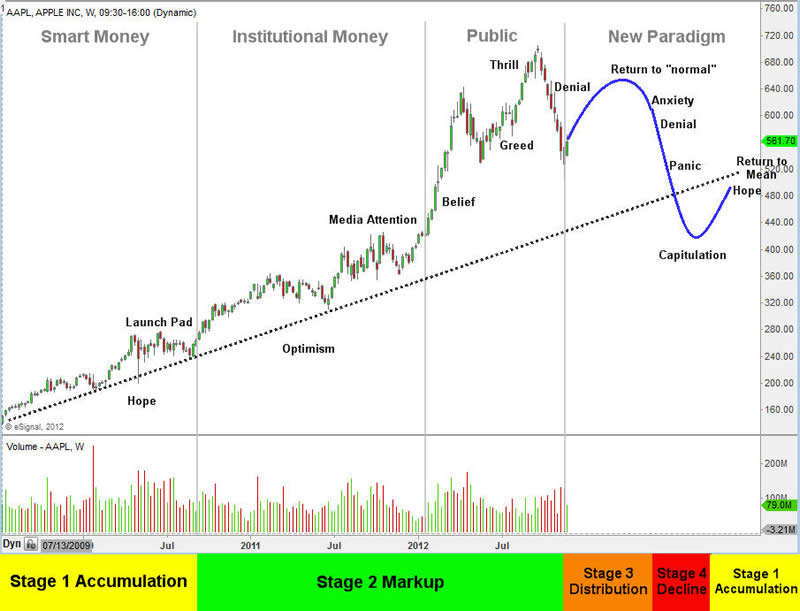
Apple, How Market Booms Turn to Busts, Trading From New Paradigm to DespairDear Reader Chris Vermeulen writes: I know most Apple enthusiasts will be rolling their eyes with my analysis and that's fine because the rest of us need people to buy our shares as we unload long positions or sell Apple short. All joking aside, the charts below clearly show some very interesting information you cannot afford to overlook. At minimum, take a quick glance at the charts which tell the full story on their own... The Four Stages of AAPL & RIMMMarkets are cyclical in nature. There is a constant process of expansion and contraction, rally and decline that continues as the market determines the theoretical fair value of a security. The sum of these moves forms an unquestionable cyclical pattern consistent within all time frames. During a cycle a stock enters different phases of support, from irrational exuberance typically found before its peak, to periods of widespread discontent where its price is continually punished. However there are never distinctly good or bad stocks. Every "good" stock will eventually become a bad one and vice versa. There are however good trades; trades that reward an investor who has correctly anticipated a move and positioned himself accordingly. It is important to note that this works with commodities like gold and silver which are trading at a VERY interesting point in their life cycle. Looking at various time frames in GLD and SLV you can see this. Classic economic theory dissects the economic cycle into four distinct stages: expansion, trough, decline and recovery. A stock is no different, and proceeds through the following cycle:
While these stages are historically defined over long time periods they actually exists in all time frames, allowing traders to take advantage of a cycle regardless of their trading time frame. Fortunately this phenomenon, known as a "fractal", exists within all security markets. A fractal is simply a rough geometric shape that can be subdivided into smaller parts that have the same properties; a smaller version of the whole. This is important to understand because through technical analysis as we are often analyzing multiple time frames. In the short term, the four stage model may repeat itself many times. The combination of these short term cycles form a medium term cycle, and the combination of multiple medium term cycles form a long term cycle. Recognition of these cycles is paramount in trading success. The Four Stages Profile:This signature profile happens over and over again in the market and all the great leaders eventually become laggards.
REAL LIFE PROFILES:
Variety in TradingInvestment securities (stocks, ETF's, options, futures) can be described as being similar to different types of athletes, each with their own unique style and personality. Some can be characterized as sprinters, participating in quick bouts of movement but tiring quickly. Others could said to be more similar to a marathoner, enduring prolonged courses in one direction without pause or interruption. When I look to make a trade I look for sprinters as historically I have had the most success with them. Other investors like pension and mutual funds are more interested in the long term marathoner that provides steady performance. There is no one way to trade; each method can be equally profitable or unprofitable. It ultimately comes down to what style works best for you, and the only way that can be determined is through trial and error. Different phases, different strategiesAs noted above, the market alternates between periods of trending activity and periods of consolidation. In a trend (stages 2 and 4) there will be an expansion of the price range in one direction. An uptrend will have a series of higher highs and higher lows (stage 2), while a down trend will produce lower highs and lower lows (stage 4). In a consolidation there will be a contraction of price range prior to a reversal in trend. This neutral stage is avoided by trend traders. A stock in stage 1 or 3 is typically correcting itself after having experience a prolonged move in one direction. These corrections are found after periods of extreme movements that often conclude with emotional and undisciplined trading at peaks and troughs. Trading these two stages is quite different than 2 and 4, and this book will teach you how to manage your risk and trade these stages responsibly. A short term consolidation within a primary trend is one area where we want to study the price action of a security for clues as to whether there will be a resumption in the trend, continued consolidation, or reversal. Sometimes however it is difficult to identify any order or consistency on any given time frame. If you are a trend trader these periods should be avoided. Trading has enough inherent challenges already and at all times a successful trader will only be searching out those trades that have a high probability of being profitable. Trading is all about finding an edge or an advantage and exploiting it for maximum profit. If there is no such edge than there is no reason to be involved. I will say this now and again many other times: Sometimes the best trade is no trade! Naturally, regardless of the stage a stock is in or your conviction of its direction, risk of financial loss is always inherent in trading and this is critical to always keep in mind. The most successful traders are not immune to this and they too will have unprofitable trades. The key is to minimize those loses by only trading those stocks that have the highest probability of being profitable. This is what separates the profitable and professional traders from those that lose money. Emotions and Lifecycle AnalysisHistory has an uncanny ability to repeat itself. Whether it's the rise and fall of an empire or the rise and fall of a stock, there are clear cycles that are prevalent throughout history. People may change, but human nature, and our ability to act, react and overreact is simply an innate part of our being. This predictability is what forms the basis of technical analysis and provides a trader with an edge with which to trade upon. When we are analyzing cycles we really are analyzing emotions, trying to gain insight as to how market participants are behaving. Upon conducting such analysis it can at times seem that markets are be behaving "irrationally" and out of order. Undisciplined traders often fall victim to their emotions and lose control of their objectivity. As people behave irrationally, so too does the market, and unfortunately these conditions can persist for long period of times. John Maynard Keynes is often quoted for suggesting that "The markets can remain irrational longer than you can stay solvent." This is a harsh reality and puts great emphasis on the importance of discipline, risk management, and a keen eye for price action. Emotions are what separate the successful traders from those that lose money. They can be regarded as a relentless opponent, often showing up without warnings and striking you at inopportune times. The successful trader is able to recognize their presence and maintain objectivity, constantly assessing their own strengths and weaknesses. There will ultimately be times where you can't control your emotions; however you can always control how you respond to them. Any time you recognize that your emotions are influencing your outlook you are already one step ahead of the average market participant. It is at this point that you step back, refocus your perceptions, examine the price action, and then take the appropriate action. An understanding of herd or mob mentality is important in trading and can provide you with an edge over the average participant who doesn't contemplate what is happening around them. In a mob or riot, we never know what the feelings and motivations are of all the individual participants. There are however certain emotions that seem to appear at distinct times and a certain predictability in their development. A stock's price action is no different. While we never know the underlying feeling and motivations of all participants, there are distinct emotions that are shared by the herd at various stages of a stock's life. An understanding of these emotions and their implications on the price action of a stock is an advantage that the profitable trader maintains. The Stock Market Lifecycle could be explained in much more detail, but this report gives you the foundation of stock / index trading cycles. I will be covering this topic in a future video with much more detail. The Apple Money Tree Is Losing Its Leaves...
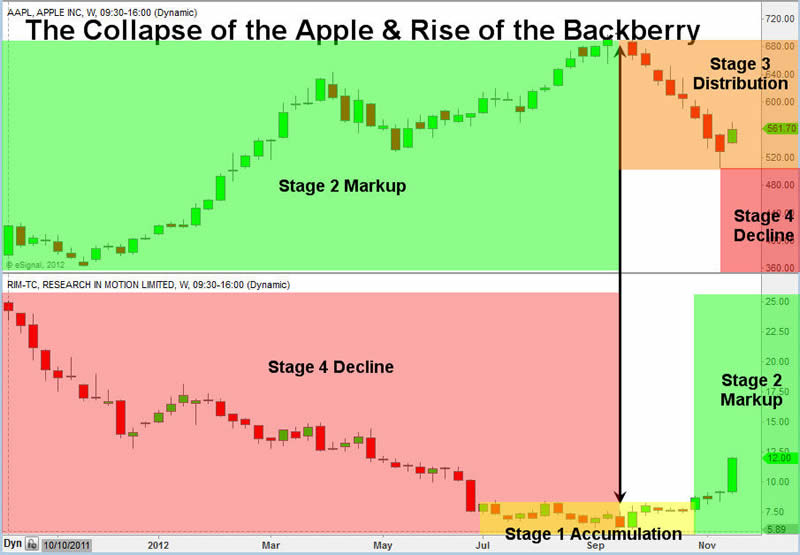
The Fruit War - Apples Top While Berries BottomIt is very interesting that AAPL shares topped the same week rim shares bottomed. Could the BB10 be the turnaround for Research in Motion? Either way the market is somewhat predictable as traders and investors buy the rumor that BB10 will be good, and they sell the news once it arrives no matter the outcome good or bad. Jan 30th is when it's unveiled so we could see RIM shares continue to claw its way out of the grave.
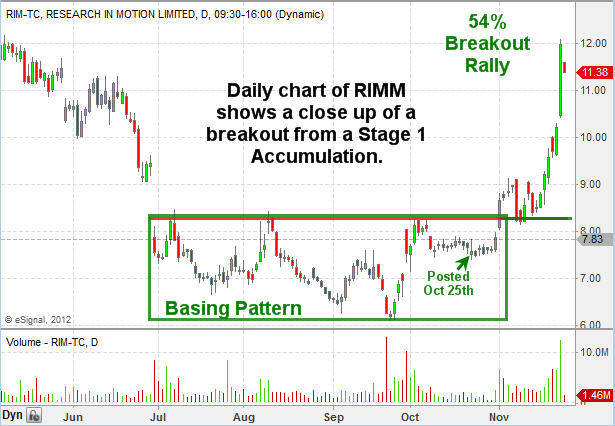
RIM - Daily Chart Look of Price Pattern
Conclusion:Knowing this information is crucial to survival as this cycle happens on all time frames (1 minute chart all the way up to yearly charts). Harnessing this information for trade selection and timing greatly reduces the amount of trades you take, while focusing only on new leaders which have massive upside potential. You can see some of my trade ideas which are in Stage 1 Accumulation mode getting ready for takeoff here: http://stockcharts.com/public/1992897 Judging from the recent price action in the broad market (SP500, NASDAQ, DOW, IWM) along with AAPL shares which have a large impact on index price direction. I feel the market is setting up for a strong Santa Clause rally in the coming week. 2013 looks like it will be a VERY exciting year for trading and investing as several sectors, stocks, and foreign country indexes are in Stage 1 Basing patterns about to start a new bull market. These major plays will become part of my trading alert service at www.TheGoldAndOilGuy.com from this point forward. By Chris Vermeulen Please visit my website for more information. http://www.TheGoldAndOilGuy.com Chris Vermeulen is Founder of the popular trading site TheGoldAndOilGuy.com. There he shares his highly successful, low-risk trading method. For 7 years Chris has been a leader in teaching others to skillfully trade in gold, oil, and silver in both bull and bear markets. Subscribers to his service depend on Chris' uniquely consistent investment opportunities that carry exceptionally low risk and high return. This article is intended solely for information purposes. The opinions are those of the author only. Please conduct further research and consult your financial advisor before making any investment/trading decision. No responsibility can be accepted for losses that may result as a consequence of trading on the basis of this analysis.
You're receiving this Email because you've registered with our website. How to Subscribe Click here to register and get our FREE Newsletter To access the Newsletter archive this link Forward a Message to Someone this link To update your preferences this link How to Unsubscribe - this link
The Market Oracle is a FREE Financial Markets Forecasting & Analysis Newsletter and online publication. | |||||||||||||