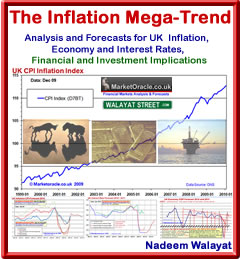
UK Inflation Mega-trend Second Anniversary Despite Continuing Delusional Deflation PropagandaStocks Stealth Bull Market 2011 Ebook Direct Download Link (PDF 2.8m/b) Interest Rate Mega-Trend Ebook Direct Download Link (PDF 2.3m/b) Inflation Mega-Trend Ebook Direct Download Link (PDF 3.2m/b) Dear Reader UK CPI inflation ended 2011 at 4.2% (December) coming down sharply from a peak of 5.2% (September) that despite the mainstream presses continuing academic backed falling inflation / deflation risk warnings remains at more than DOUBLE the Bank of England's 2% target that continues to make a mockery of the central bank whose primary remit is supposedly price stability. CPI 3% was supposed to have been the maximum level a break above which was supposed to trigger a series of panic measures to bring inflation under control, instead of which the Bank of England has instead opted to print money that to date officially totals £275 billion of electronic money printing that the fractional reserve banking system will eventually leverage to over £1 trillion for the primary objective for the monetization of government debt as warned of now 2 years ago in the Inflation Mega-Trend Ebook (Free Download). UK debt continues to be monetized at the approx rate of 15% per annum, with only the deflation fools and vested interest academic economists unable to realise the highly inflationary consequences of governments monetizing their own debt. For the risk is not just what we witnessed during 2011, but the risks are of loss of confidence in fiat currency amidst a panic that would fast accelerate towards hyperinflation. UK Inflation Forecast 2011 UK inflation ending the year at 4.2% is set against my January 2011 forecast (17 Jan 2011 - UK Inflation Forecast 2011, Imminent Spike to Above CPI 4%, RPI 6% ) that expected Inflation to remain above Bank of England's 3% upper limit for the whole of 2011 ending the year at 3.2%, which is set against the Bank of England's Feb 2011 Inflation Report that expected CPI of just 1.7% by the end of 2011.
However, actual inflation as experienced by most people in Britain currently stands at a far higher rate of 6%, which explains why your weekly groceries bill is inflating at near twice the rate of official inflation indices that have been manipulated by successive governments to under-report the true rate of inflation. Britains Inflationary Depression Whilst the inflation rate looks set to continue correcting lower into early 2012 as the UK economy starts to sputter in response to the Euro-zone in meltdown, with most of its member countries being consumed by debt deflationary black holes as they are unable to print money and devalue against Germany that further lacks any real means for internal transfer payments. However the UK still remains in an ongoing Inflationary Depression. Contrary to the Bank of England's economic propaganda of high inflation always being just temporary (for over 2 years now), there is nothing surprising about persistently high inflation as I warned of 2 years ago in the Inflation Mega-trend ebook (FREE DOWNLOAD), high inflation is a deliberate and inevitable policy of the stealth default on UK public and private debt. The trend of high inflation is likely to persist for the whole decade because the government continues to accumulate new debt at the rate of at least £120 billion per year which remains on the SAME debt accumulation trajectory as the last Labour government despite the cuts and austerity propaganda. Bank of England's Inflation Economic Propaganda High UK Inflation that apparently surprised everyone to the upside for virtually the whole of 2010, by spiking and remaining above 3% from early 2010 illustrates the tendency of the mainstream press to basically regurgitate the views of vested interests that have beaten the drum of always imminent DEFLATION for the whole of 2010 and much of 2011 as high inflation was always just temporary and should be ignored by the general population, which is the precise message still being bleated out in the mainstream press today. To look at the reason why high inflation is being ignored we have to look beyond journalists, we have to look beyond academic economists that are paid to follow a school of thought that their pay masters want to push in the media. The place to look for the reason why high Inflation is being ignored is to the very top of the financial pyramid, the Bank of England. The connection that the mainstream press has never been able to make is that the Bank of England does NOT make Forecasts. Instead the Bank of England quarterly inflation forecast reports are nothing more than ECONOMIC PROPAGANDA, that virtually always converge towards the Bank of England achieving its 2% Inflation target in 2 years time, despite the fact that historical analysis shows that the Bank of England FAILS in achieving its 2% target 97% of the time. The following are the last 8 quarterly Inflation forecast reports by the Bank of England issued from February 2010 to November 2011 that were instrumental in academic economists and journalists in the mainstream press regurgitating the always temporarily high inflation mantra of the past 2 years, despite CPI spiking to 5.2% and still remaining at more than double the 2% Target. Bank of England February 2010 Inflation Report
UK Inflation by Feb 2010 had as I anticipated spiked to above 3% (27 Dec 2009 - UK CPI Inflation Forecast 2010, Imminent and Sustained Spike Above 3%). However the Bank of England's Feb 2010 Inflation Report forecast the spike as being temporary and to imminently resolve in severe disinflation to target a rate of below CPI 1% by December 2010, instead actual UK Inflation for December was 3.7%. The forecast for by the end 2011 was for just 1.2%. Bank of England May 2010 Inflation Report
The May 2010 Inflation report continued with the mantra of temporarily high inflation that would resolve in a rate of about 1.7% by the end of 2010, on the basis of spare capacity in the economy, the blatant flaw in the Bank of England's argument is the fact that much if not all of the spare capacity had been destroyed during the Great Recession of 2008-2009, since Britain did not have much of a manufacturing base to start with. The forecast for end 2011 was now revised to 1.3%. Bank of England August 2010 Inflation Report
The mantra of spare capacity placing downward pressure on wages to resolve in disinflation continued in the August 2010 Inflation Report. However now with most of 2010 gone, The CPI target for 2010 was revised higher to 3% from 1% (Feb 2010), with CPI for 2011 forecast to resolve to 1.2%, and a sub 2% CPI in 2 years time. Bank of England November 2010 Inflation Report
The Bank of England's November 2010 Inflation Report (November 2010) forecast UK CPI Inflation to target an early 2011 peak of 3.5% before inflation falls to approx 1.7% by end of 2011, and for inflation to remain well below 2% into the end of 2012, therefore supporting the Bank of England's persistent view that everyone should focus on the Deflation threat and ignore high inflation during early 2011 so as the Bank of England can continue to keep interest rates well below the real rate of inflation for the purpose of funneling savers wealth and tax payers cash onto the balance sheet of the bailed out bankrupt banks. Bank of England February 2011 Inflation Report
The Feb inflation report (Feb 2011) revised the forecast for UK Inflation for end 2011 to approx 2.3% and yet again UK inflation in 2 years time would as if by margin fall to below 2% and therefore the real threat remained DEFLATION. Bank of England May 2011 Inflation Report
The May inflation report (May 2011) revised UK Inflation for end 2011 to 4%, compare that against a range of between 1.2% and 1.7% pumped out as deflation mantra during the whole of 2010. Bank of England August 2011 Inflation Report
The August 2011 Inflation amidst a panic of uncertainty at the Bank of England in recognition of not having a clue now forecast a spike in CPI to end 2011 at 5.2%, which is set against the Bank of England's propaganda that it would fall to below 2%. That 5.2% spike came in the following month (September 2011) which was set against the BoE forecast of barely 2 months earlier suggesting a 4.5% inflation rate for September. Bank of England November 2011 Inflation Report
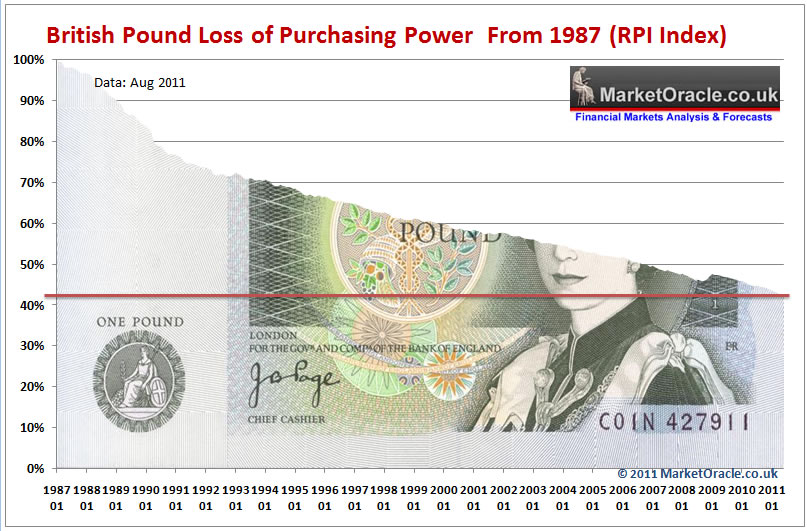
The most recent Inflation report of November 2011 forecasts Inflation to fall sharply over 2012, to end the year at approx 1.1% due to impacts from VAT, falling energy prices and labour market pressures, and at approx 1.3% by the end of 2013. A reminder of where the Bank of England forecast CPI Inflation would be by now a year ago 1.7%, and 2 years ago 1.2%. Britain's Savers and Workers Continue to be Punished for the Bankster Crimes The British population continues to be fooled by economic smoke and mirrors propaganda into bailing out the bankster's at unlimited liability so that no bankster generated bad debts have been defaulted upon, every bond issued by the bankster's that they continue to collect bonuses upon is still being honoured by the tax payers of Britain at huge personal expense that will continue to be born for many years if not decades. The primary mechanism for this stealth theft of wealth is by means of high real inflation induced loss of purchasing power of earnings that has been effectively masked from the public in the UK who are increasingly experiencing the real pain of not being able to maintain their standards of living without triggering angry public demonstrations compared to the near revolution that is taking place in Greece in the face of actual pay cuts, as Greece being part of the Euro-zone means it's government is unable to print money and use the inflation smoke and mirrors illusion to steal its populations wealth, but rather it is ultimately for German tax payers to finance the Greece state with loans that will never be repaid even in nominal terms let along real terms. Off course this is out of self interest to preserve and protect their own bankster's that rule Germany with nearly as iron a fist as their last dictator. However theft of wealth by means of inflation is nothing new because governments printing money to buy votes is a perpetual policy of ALL democracies as the below graph illustrates the steady theft of purchasing power of sterling on the RPI inflation measure shows that over the past 24 years near 60% of the purchasing power of sterling has been stolen and funneled to those that control the printing of money, namely the banking elite.
Therefore the workers of Britain are in the exact same boat as the workers of Greece, it's just that for the Greeks the theft is obvious as they actually see their pay being cut, whereas in Britain the theft is executed stealthily, slyly by the masters of economic propaganda with chief propagandists such as Mervyn King uttering soothing phrases every now and then of temporarily high inflation that the mainstream press and academic economists (vested interests) lap up and regurgitate at length so as to manage the populations inflation expectations. Savers experience the stealth theft of wealth where even the best savings accounts paying 3% are still resulting in a loss of life time accumulated wealth to tune of at least 3% per year (RPI and after basic income tax). For savers to just break even they would need to be in receipt of a savings rate of at least 6. My next serious of in-depth analysis will seek to formulate detailed Inflation trend expectations for at least 2012 and more likely into 2015. That seeks to answer key questions such as how can we have inflation if wages are falling in real terms ? To get this analysis and concluding detailed forecasts in your email in box, ensure you are subscribed to my always free newsletter. Source and Comments: http://www.marketoracle.co.uk/Article32704.html By Nadeem Walayat Copyright © 2005-2012 Marketoracle.co.uk (Market Oracle Ltd). All rights reserved. Nadeem Walayat has over 25 years experience of trading derivatives, portfolio management and analysing the financial markets, including one of few who both anticipated and Beat the 1987 Crash. Nadeem's forward looking analysis focuses on UK inflation, economy, interest rates and housing market. He is the author of three ebook's - The Inflation Mega-Trend; The Interest Rate Mega-Trend and The Stocks Stealth Bull Market Update 2011 that can be downloaded for Free.
Nadeem is the Editor of The Market Oracle, a FREE Daily Financial Markets Analysis & Forecasting online publication that presents in-depth analysis from over 600 experienced analysts on a range of views of the probable direction of the financial markets, thus enabling our readers to arrive at an informed opinion on future market direction. http://www.marketoracle.co.uk Disclaimer: The above is a matter of opinion provided for general information purposes only and is not intended as investment advice. Information and analysis above are derived from sources and utilising methods believed to be reliable, but we cannot accept responsibility for any trading losses you may incur as a result of this analysis. Individuals should consult with their personal financial advisors before engaging in any trading activities.
You're receiving this Email because you've registered with our website. How to Subscribe Click here to register and get our FREE Newsletter To access the Newsletter archive this link Forward a Message to Someone this link To update your preferences this link How to Unsubscribe - this link
The Market Oracle is a FREE Financial Markets Forecasting & Analysis Newsletter and online publication. | ||||||||||||||

Thursday 19 January 2012
UK Inflation Mega-trend Second Anniversary Despite Continuing Delusional Deflation Propaganda
Sunday 15 January 2012
Welcome to our Newsletter
Please keep this email for later reference.
Your email address has been added to the following newsletter(s):
*Market Oracle Newsletter
To update your details and preferences please go to
http://www.marketoracle.info/?p=preferences&uid=c6dac89b760f91c70b3b9ca3b16db2a7.
If you do not want to receive any more messages, please go to
http://www.marketoracle.info/?p=unsubscribe&uid=c6dac89b760f91c70b3b9ca3b16db2a7.
You can access the newsletter archive (delayed updating) here -
http://www.marketoracle.co.uk/Topic19.html
The Stocks Stealth Bull Market Update 2011 Ebook download - (2.8meg) -
http://www.marketoracle.co.uk/pdf-1016/Stocks-Stealth-Bull-Market-2011-by-Nadeem-Walayat.pdf
The Interest Rate Mega-Trend Ebook download - (2.2 meg pdf) -
http://www.marketoracle.co.uk/pdf-a/The_Interest_Rate_Mega_Trend_Ebook_by_N_Walayat.pdf
The Inflation Mega-Trend Ebook download (3.2 meg pdf) -
http://www.marketoracle.co.uk/pdf-1016/The_Inflation_Mega-Trend_Nadeem_Walayat.pdf
Thank you
Sarah Jones
Site Administrator
http://www.marketoracle.co.uk
Sunday 1 January 2012
January Home Buyer's Newsletter
at the end of the newsletter.
+++++++++++ January 1, 2012 +++++++++++++++++++
CONTENTS:
Introduction: Both Existing and New Home Sales Rise
Mortgage Rate Update: Rates Decline in December
This Month's Tip: Be Budget Wise
++++++++++++++++++++++++++++++++++++++++++++
Introduction: Both Existing and New Home Sales Rise
Welcome to the January edition of the Home Buyer's Newsletter. A very
Happy New Year to all and wishes for a wonderful 2012.
Existing-home sales rose again in November and remain above a year ago,
according to the National Association of Realtors®. Also released on December
21st were periodic benchmark revisions with downward adjustments to sales and
inventory data since 2007, led by a decline in for-sale-by-owners.
Although rebenchmarking resulted in lower adjustments to several years of home
sales data, the month-to-month characterization of market conditions did not change.
There are no changes to home prices or month's supply.
The latest monthly data shows total existing-home sales, which are completed
transactions that include single-family, townhomes, condominiums and co-ops,
increased 4.0 percent to a seasonally adjusted annual rate of 4.42 million in
November from 4.25 million in October, and are 12.2 percent above the 3.94
million-unit pace in November 2010.
Lawrence Yun, NAR chief economist, said more people are taking advantage of
the buyer's market. "Sales reached the highest mark in 10 months and are 34
percent above the cyclical low point in mid-2010 – a genuine sustained sales
recovery appears to be developing," he said. "We've seen healthy gains in
contract activity, so it looks like more people are realizing the great
opportunity that exists in today's market for buyers with long-term plans."
On the new home side, sales of new single-family houses in November 2011 were
at a seasonally adjusted annual rate of 315,000, according to estimates released
jointly on December 23rd by the U.S. Census Bureau and the Department of Housing
and Urban Development. This is 1.6 percent (±12.2%) above the revised October rate
of 310,000 and is 9.8 percent (±19.5%)* above the November 2010 estimate of 287,000.
The median sales price of new houses sold in November 2011 was $214,100; the average
sales price was $242,900. The seasonally adjusted estimate of new houses for sale at
the end of November was 158,000. This represents a supply of 6.0
months at the current sales rate.
+++++++++++++++++++++++++++++++++++++++++++++
Mortgage Rate Update: Rates Decline in December
December saw a continuation of easing in long-term interest rates, although these
rates continue in the same general range we have seen since the month of October.
For 30-year fixed-rate mortgages, the average rate declined from 4.00% at the
beginning of the month to 3.91% at the end, according to mortgage company Freddie
Mac. 15-year fixed-rate averages were at 3.21% at the end of the month after
beginning the period with an average of 3.30%.
Although there have been some minor fluctuations, these averages have not varied
a great deal in the last 90 days, which may indicate that we are bouncing around
the bottom range of rates. Barring some huge economic issue, we would not expect
to see large scale reductions from this point onward.
For current average mortgage rates, see:
<A HREF="http://www.ourfamilyplace.com/homebuyer/rates.html">Mortgage Rates</A>
For an extensive discussion of all aspects of mortgages, see the section on the
site devoted to this subject. <A HREF="http://www.ourfamilyplace.com/homebuyer/mortgage.html">Mortgages</A>
++++++++++++++++++++++++++++++++++++++++++++++
Sponsor: Looking to Compare Agents? Try HomeGain.com
The most important part of your team for buying a home should be
your real estate Agent. Want to anonymously (and without obligation)
compare Agents? You can compare experience, background and
much more at HomeGain.com.
<A HREF="http://www.homegain.com/sp/ae_intro.html?entryid=2267&ht=houseclicksAE">Compare Agents</A>
++++++++++++++++++++++++++++++++++++++++++++++
This Month's Tip: Be Budget Wise
Frequently, the approach to buying a home is a backward one:
Potential buyers spend loads of time looking at specific
homes, furnishing them in their minds, having friends and
family over for virtual parties. Unfortunately, they miss
the very first step, which is taking the time necessary to
get a firm grip on their current (and future) budget. If you
are just entering the home buying market, getting the budget
piece in order first will smooth the way through the entire process.
Not only will it help you to afford your home, those with their
budgets in check generally live less stressful lives and,
by efficiently handling their finances, have more funds
available for the things that they truly need and want.
Getting control of your financial situation generally involves
one or two big steps and, frequently, a number of smaller ones.
The combination of the moves you make to get your budget in
line can make a huge difference in your overall financial
posture. It can make the difference between affording--or
not being able to afford--a home. It can mean a comfortable
homeownership experience, or a harried and distasteful one.
Taking Control
The very first step in taking control of your finances--and
your budget--is developing a minset that says you CAN be in
control, that you CAN become budget minded. If you've spent
years as a spendthrift, this may take some getting used to.
Instead of "I deserve it," you may need to begin saying "I
really don't need it." You may need to put a leash on some
of your expenditures. The easiest way of doing this is to
understand that there is a big difference between what you
WANT and what you NEED. For example, you may WANT a big
gas-guzzling SUV, but what you NEED is probably just a vehicle
that will get you back and forth to work reliably.
Compare
One of the most important steps in getting your budget in
line is to begin the process of comparison shopping for
virtually everything you buy. If you currently make
purchases for convenience rather than price, this new
approach may take some getting used to, but eventually
it will become second-nature.
+ Learn which grocery stores have the lowest overall
price and do the bulk of your shopping there.
+ Watch for sale prices in ads and circulars--buying
like this can reap big savings over time.
+ Use the Internet to make comparisons. There are
numerous sites that will do the actual price comparisons--
including shipping--for products you need to buy. This
is an especially effective tactic in the purchase of
higher-ticket items.
Large or small--It all adds up
Although keeping tabs on the big expenditures (cars,
furniture, appliances and the like) show the quickest
rewards, your total spending for smaller items (groceries,
fuel, supplies and services are some examples) can also
have a big effect on your bottom line. For example, do you
stock up on items when they are on sale or do you pay full
price when the whim hits you? Do you use generic or store
brands, which are often 25-40% less than name brands? If
you insist on name brands, do you clip coupons (and use the
coupons at stores that double or triple their value)? Are
you paying for cellular minutes that you rarely or never
use? How about premium cable or satellite packages with
stations that you almost never watch? How often do you
buy trinkets and "toys" that you never use or even look
at much less use?
Saving money here--on these smaller items--really does add
up. Just a few slight adjustments in buying approaches
and habits can often save $30-40 per month in your grocery
bill, for example. Eliminating an "upper tier" on cable or
satellite may equate to another $25 per month or more. Buying
less "junk" that you don't use can show considerable savings,
depending on how much a "junk" shopper you are. Unless you
are currently a "bare bones" spender, it is not unusual to
be able to cut $100, $200, $300 or more from your current
monthly spending patterns. And that adds up to big money,
even before you factor in the interest that you can gain on
the money you put away. Don't forget to shop for the best
interest rate, too, since on a money market (where you can
have near-immediate access to your cash) interest rates can
vary from less than a quarter percent to over 5%--more than
20 times more interest!
Summing Up
The real estate market has changed dramatically in the last
several years, altering the playing field extensively.
This means that you will need to be much more conscious of
budget considerations than you would have needed to be just
a few short years ago. Having a handle on your budget and
finances may be the difference between being able to afford
a home and not affording one--especially if credit availability
and standards tighten.
Next Month's Tip: All About Homeowners' Associations
++++++++++++++++++++++++++++++++++++++++++++++
The Home Buying Checklist
Many of our visitors have said that one of the most valuable
aspects of the Home Buyer's Information Center is the
Buying Checklist, where they can make sure that all
the bases have been touched. You can find the checklist
here: <A HREF="http://www.ourfamilyplace.com/homebuyer/checklist.html">Home Buyer's Checklist</A>
A special thanks to all those who have written to let us know
that they have found the Home Buyer's Information Center a
helpful resource in their buying process.
Have a great month and good luck in all your endeavors!
The Team at the Home Buyer's Information Center
_____________________________
Change email address / Leave mailing list: http://ymlp280.net/ugumyqmbgsgbbmwgwq
Powered by YourMailingListProvider