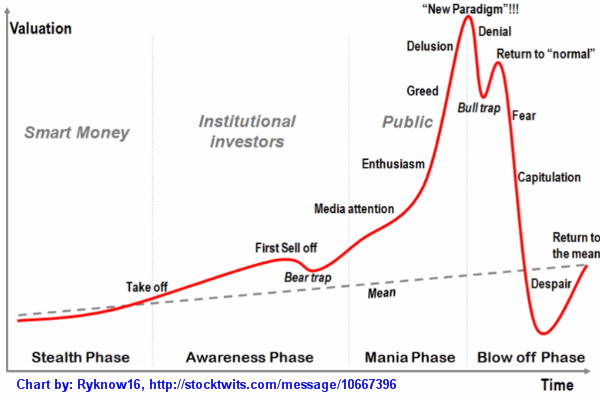
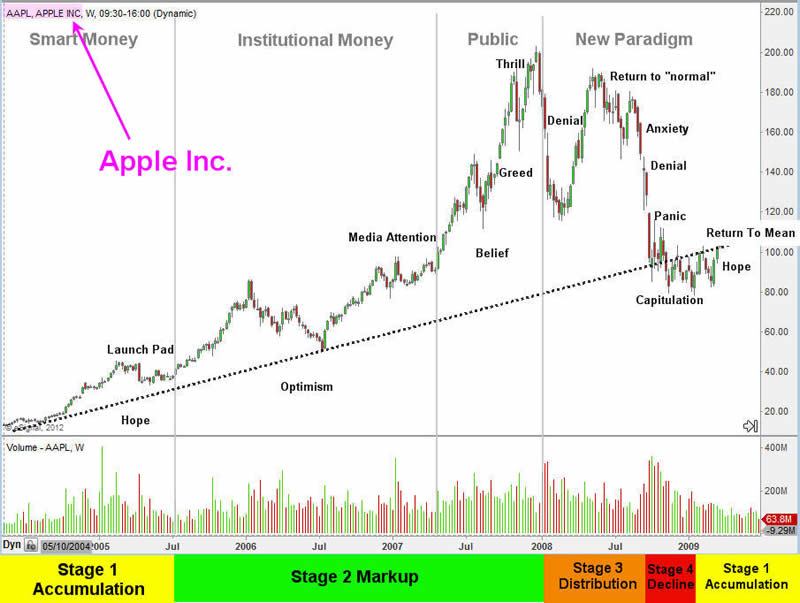
Apple, How Market Booms Turn to Busts, Trading From New Paradigm to DespairDear Reader Chris Vermeulen writes: I know most Apple enthusiasts will be rolling their eyes with my analysis and that's fine because the rest of us need people to buy our shares as we unload long positions or sell Apple short. All joking aside, the charts below clearly show some very interesting information you cannot afford to overlook. At minimum, take a quick glance at the charts which tell the full story on their own... The Four Stages of AAPL & RIMMMarkets are cyclical in nature. There is a constant process of expansion and contraction, rally and decline that continues as the market determines the theoretical fair value of a security. The sum of these moves forms an unquestionable cyclical pattern consistent within all time frames. During a cycle a stock enters different phases of support, from irrational exuberance typically found before its peak, to periods of widespread discontent where its price is continually punished. However there are never distinctly good or bad stocks. Every "good" stock will eventually become a bad one and vice versa. There are however good trades; trades that reward an investor who has correctly anticipated a move and positioned himself accordingly. It is important to note that this works with commodities like gold and silver which are trading at a VERY interesting point in their life cycle. Looking at various time frames in GLD and SLV you can see this. Classic economic theory dissects the economic cycle into four distinct stages: expansion, trough, decline and recovery. A stock is no different, and proceeds through the following cycle:
While these stages are historically defined over long time periods they actually exists in all time frames, allowing traders to take advantage of a cycle regardless of their trading time frame. Fortunately this phenomenon, known as a "fractal", exists within all security markets. A fractal is simply a rough geometric shape that can be subdivided into smaller parts that have the same properties; a smaller version of the whole. This is important to understand because through technical analysis as we are often analyzing multiple time frames. In the short term, the four stage model may repeat itself many times. The combination of these short term cycles form a medium term cycle, and the combination of multiple medium term cycles form a long term cycle. Recognition of these cycles is paramount in trading success. The Four Stages Profile:This signature profile happens over and over again in the market and all the great leaders eventually become laggards.
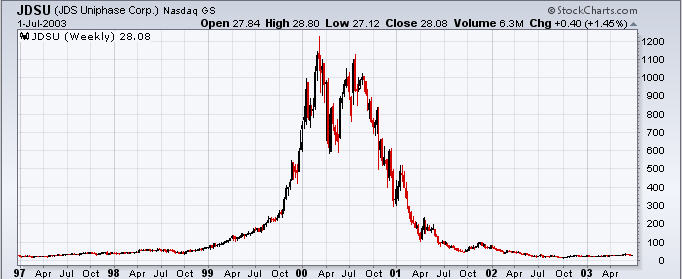
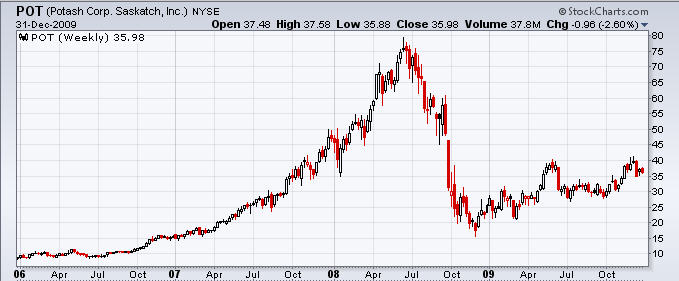
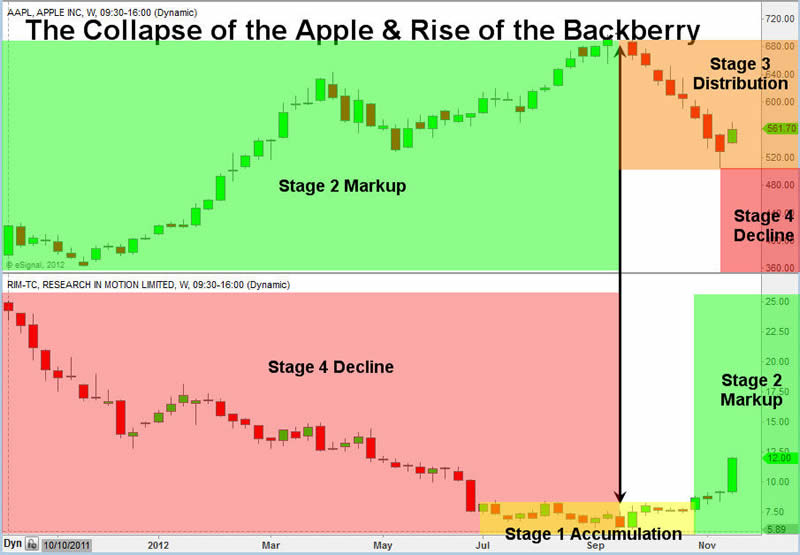
REAL LIFE PROFILES:
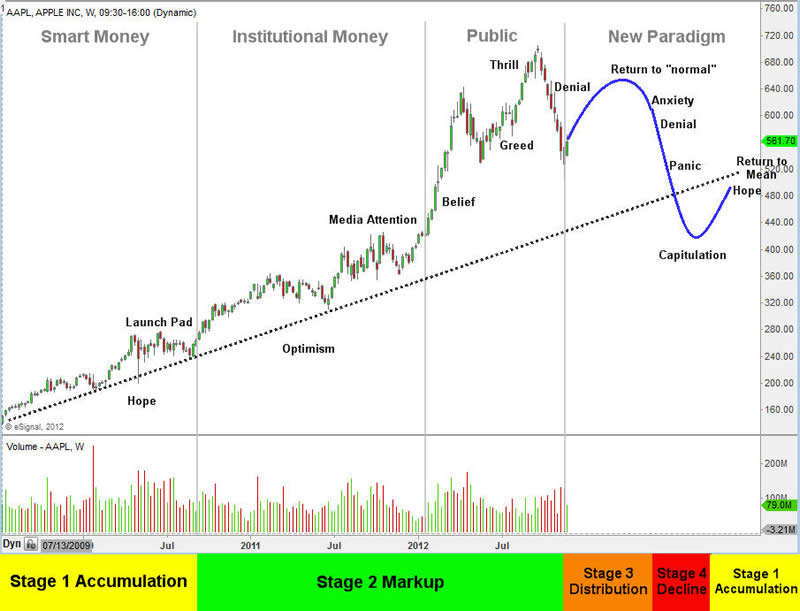
Variety in TradingInvestment securities (stocks, ETF's, options, futures) can be described as being similar to different types of athletes, each with their own unique style and personality. Some can be characterized as sprinters, participating in quick bouts of movement but tiring quickly. Others could said to be more similar to a marathoner, enduring prolonged courses in one direction without pause or interruption. When I look to make a trade I look for sprinters as historically I have had the most success with them. Other investors like pension and mutual funds are more interested in the long term marathoner that provides steady performance. There is no one way to trade; each method can be equally profitable or unprofitable. It ultimately comes down to what style works best for you, and the only way that can be determined is through trial and error. Different phases, different strategiesAs noted above, the market alternates between periods of trending activity and periods of consolidation. In a trend (stages 2 and 4) there will be an expansion of the price range in one direction. An uptrend will have a series of higher highs and higher lows (stage 2), while a down trend will produce lower highs and lower lows (stage 4). In a consolidation there will be a contraction of price range prior to a reversal in trend. This neutral stage is avoided by trend traders. A stock in stage 1 or 3 is typically correcting itself after having experience a prolonged move in one direction. These corrections are found after periods of extreme movements that often conclude with emotional and undisciplined trading at peaks and troughs. Trading these two stages is quite different than 2 and 4, and this book will teach you how to manage your risk and trade these stages responsibly. A short term consolidation within a primary trend is one area where we want to study the price action of a security for clues as to whether there will be a resumption in the trend, continued consolidation, or reversal. Sometimes however it is difficult to identify any order or consistency on any given time frame. If you are a trend trader these periods should be avoided. Trading has enough inherent challenges already and at all times a successful trader will only be searching out those trades that have a high probability of being profitable. Trading is all about finding an edge or an advantage and exploiting it for maximum profit. If there is no such edge than there is no reason to be involved. I will say this now and again many other times: Sometimes the best trade is no trade! Naturally, regardless of the stage a stock is in or your conviction of its direction, risk of financial loss is always inherent in trading and this is critical to always keep in mind. The most successful traders are not immune to this and they too will have unprofitable trades. The key is to minimize those loses by only trading those stocks that have the highest probability of being profitable. This is what separates the profitable and professional traders from those that lose money. Emotions and Lifecycle AnalysisHistory has an uncanny ability to repeat itself. Whether it's the rise and fall of an empire or the rise and fall of a stock, there are clear cycles that are prevalent throughout history. People may change, but human nature, and our ability to act, react and overreact is simply an innate part of our being. This predictability is what forms the basis of technical analysis and provides a trader with an edge with which to trade upon. When we are analyzing cycles we really are analyzing emotions, trying to gain insight as to how market participants are behaving. Upon conducting such analysis it can at times seem that markets are be behaving "irrationally" and out of order. Undisciplined traders often fall victim to their emotions and lose control of their objectivity. As people behave irrationally, so too does the market, and unfortunately these conditions can persist for long period of times. John Maynard Keynes is often quoted for suggesting that "The markets can remain irrational longer than you can stay solvent." This is a harsh reality and puts great emphasis on the importance of discipline, risk management, and a keen eye for price action. Emotions are what separate the successful traders from those that lose money. They can be regarded as a relentless opponent, often showing up without warnings and striking you at inopportune times. The successful trader is able to recognize their presence and maintain objectivity, constantly assessing their own strengths and weaknesses. There will ultimately be times where you can't control your emotions; however you can always control how you respond to them. Any time you recognize that your emotions are influencing your outlook you are already one step ahead of the average market participant. It is at this point that you step back, refocus your perceptions, examine the price action, and then take the appropriate action. An understanding of herd or mob mentality is important in trading and can provide you with an edge over the average participant who doesn't contemplate what is happening around them. In a mob or riot, we never know what the feelings and motivations are of all the individual participants. There are however certain emotions that seem to appear at distinct times and a certain predictability in their development. A stock's price action is no different. While we never know the underlying feeling and motivations of all participants, there are distinct emotions that are shared by the herd at various stages of a stock's life. An understanding of these emotions and their implications on the price action of a stock is an advantage that the profitable trader maintains. The Stock Market Lifecycle could be explained in much more detail, but this report gives you the foundation of stock / index trading cycles. I will be covering this topic in a future video with much more detail. The Apple Money Tree Is Losing Its Leaves...
The Fruit War - Apples Top While Berries BottomIt is very interesting that AAPL shares topped the same week rim shares bottomed. Could the BB10 be the turnaround for Research in Motion? Either way the market is somewhat predictable as traders and investors buy the rumor that BB10 will be good, and they sell the news once it arrives no matter the outcome good or bad. Jan 30th is when it's unveiled so we could see RIM shares continue to claw its way out of the grave.
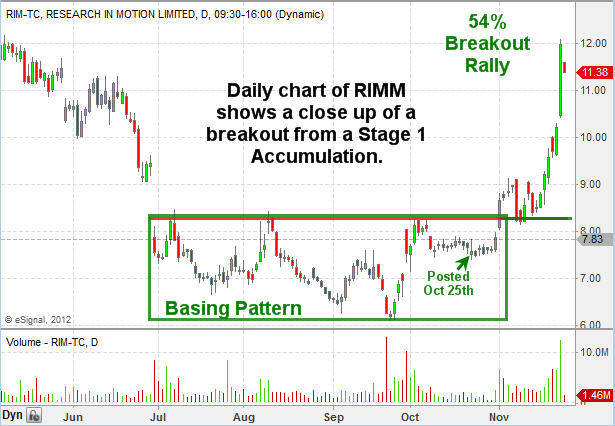
RIM - Daily Chart Look of Price Pattern
Conclusion:Knowing this information is crucial to survival as this cycle happens on all time frames (1 minute chart all the way up to yearly charts). Harnessing this information for trade selection and timing greatly reduces the amount of trades you take, while focusing only on new leaders which have massive upside potential. You can see some of my trade ideas which are in Stage 1 Accumulation mode getting ready for takeoff here: http://stockcharts.com/public/1992897 Judging from the recent price action in the broad market (SP500, NASDAQ, DOW, IWM) along with AAPL shares which have a large impact on index price direction. I feel the market is setting up for a strong Santa Clause rally in the coming week. 2013 looks like it will be a VERY exciting year for trading and investing as several sectors, stocks, and foreign country indexes are in Stage 1 Basing patterns about to start a new bull market. These major plays will become part of my trading alert service at www.TheGoldAndOilGuy.com from this point forward. By Chris Vermeulen Please visit my website for more information. http://www.TheGoldAndOilGuy.com Chris Vermeulen is Founder of the popular trading site TheGoldAndOilGuy.com. There he shares his highly successful, low-risk trading method. For 7 years Chris has been a leader in teaching others to skillfully trade in gold, oil, and silver in both bull and bear markets. Subscribers to his service depend on Chris' uniquely consistent investment opportunities that carry exceptionally low risk and high return. This article is intended solely for information purposes. The opinions are those of the author only. Please conduct further research and consult your financial advisor before making any investment/trading decision. No responsibility can be accepted for losses that may result as a consequence of trading on the basis of this analysis.
You're receiving this Email because you've registered with our website. How to Subscribe Click here to register and get our FREE Newsletter To access the Newsletter archive this link Forward a Message to Someone this link To update your preferences this link How to Unsubscribe - this link
The Market Oracle is a FREE Financial Markets Forecasting & Analysis Newsletter and online publication. | |||||||||||||

Sunday 25 November 2012
Apple, How Market Booms Turn to Busts, Trading From New Paradigm to Despair
Sunday 18 November 2012
Israel Military Implements Gaza War, Phase1 of Iran Nuclear Attack Plan
Israel Military Implements Gaza War, Phase1 of Iran Nuclear Attack PlanStocks Stealth Bull Market 2011 Ebook Direct Download Link (PDF 2.8m/b) Interest Rate Mega-Trend Ebook Direct Download Link (PDF 2.3m/b) Inflation Mega-Trend Ebook Direct Download Link (PDF 3.2m/b) Dear Reader It is no news that the Israeli Prime Minister Benjamin Netanyahu has been preparing the world for an attack against Iran all year, as illustrated by the PM's September visit and speech at the UN (Netanyahu Warns of Attack on Iran). In a continuation of the propaganda war, Channel 4 recently aired a fly on the wall documentary into the suggested thought processes that the Israeli Government, Military and Intelligence agencies were going through during September 2012 as they war gamed the consequences of a unilateral attack against Iran's air defence, missile and nuclear infrastructure, and how the aftermath could play out in terms of world reaction and Iranian military response.
Whilst the programme reeked of propaganda for the camera's towards justification for an attack against Iran, as those involved were clearly attempting to talk the wider world into believing that the consequences of an attack against Iran would be contained i.e. that Iranian retaliation would be limited due to fears of drawing the US into the conflict. However, one of the consequences that the Israeli war gamers could not mask in the aftermath of an attack on Iran would be the thousands of rockets and longer range missile attacks from Iranian proxies in Gaza and Lebanon who's numbers were more than capable of overcoming Israel's missile defence shield that could perhaps deal with upto 200 rockets per day rather than the prospects for peak attacks of probably over 2000 per day that would be in addition to any remaining Iranian longer range missiles that Israel hoped to degrade during the initial air war. Therefore clearly at the forefront of the Israeli military planning for an attack against Iran has been towards engineering an scenario that would allow Israel to degrade the longer range rockets that could be fired out of both Gaza and Lebanon that would allow Israel's missile defences to be better able to deal with he aftermath of an air war against iranian military and nuclear infrastructure as it would take significant military capability for Iran to retaliate off the military map, as well as improving the probability of earlier US Military intervention in an air war against Iran, by allowing a scenario to unfold that would draw the US into the region under guise of being at the defence of Israel. Phase 1 - Invade Gaza and Degrade Rockets Capability - November 2012 Israeli Prime Minister Benjamin Netanyahu, facing an election in January 2013 had clearly put the Gaza attack plans on low gear until after the US Presidential election, following which Israel virtually immediately embarked upon a series of military provocations including sending tanks into Gaza on November 8th that killed a Palestinian child, then 2 days later fired a number of shells into Gaza killing a 4 civilians and wounding 38 others. The trigger for Gaza retaliation was the targeted assassinations of Hamas military commander Ahmed Jabari who was killed by a missile that was followed by an extensive bombing campaign to inflame Hamas into retaliating with longer range rockets.
The Israeli Government is using Hamas retaliation as political cover for the justification for an all out air and ground assault against Gaza with the primary objective for seeking out and destroying much of Hamas's longer range rocket stock piles. Hamas by firing a dozen or so rockets at Tel-Aviv is following Israeli war planners strategy as it plays well to Israeli and western audiences that an assault upon Gaza is justified.
The Gaza War Phase 1 invasion now appears imminent, as already upwards of 100,000 Israeli troops have started to mass on Gaza's border as the bombardment continues to pave it's way for an invasion of Gaza. The estimated consequences of Phase 1, if inline with the last Gaza war in the run up to the 2009 Israeli elections could see some 2000 Palestinian deaths against an estimated 30 Israeli, and likely to result in a short lived invasion of less than 1 month as Israel would soon require the troops for Phase2. Phase 2 - Invasion of Lebanon, Degrade Hezbollah - December 2012 Following the destruction of Hamas's Gaza ability to retaliate following an attack on Iran, and Syria being out of the picture, the Israeli war machine will next eye Phase 2 for a similar programme of first provocation, then invasion and destruction of Hezbollah military infrastructure, which would include carving out a semi-temporary buffer zone in South Lebanon so as to prevent small range rockets and mortars from being fired into northern Israel. Therefore Israel will towards the latter stages of the Gaza War (in a matter of weeks), provoke attacks from Hezbollah by using similar tactics of drone attack assassinations of the leadership of Hezbollah with the main objective for Invasion and ongoing occupation of southern Lebanon so as to diminish the capability for Iranian response via Hezbollah. The estimated consequences of Phase 2, if inline with the last 2006 Lebanon war could see at least 1500 Lebanese deaths (mostly civilian) and an estimated 150 Israeli deaths (mostly military), with the occupation likely to continue until well after an attack against Iran is underway. Phase 3 - Attack on Iranian Military and Nuclear Infrastructure - January 2013 It is highly likely that an attack against Iranian nuclear and military infrastructure would follow at the peak of Israeli incursion into southern Lebanon as that would have Hezbollah under maximum pressure, which suggests that such an attack could take place some time during January 2013, in the run up to the Israeli General Election.
Given that much of Iranian nuclear infrastructure is deep under ground (under a mountain), limited Israeli ground forces may also be deployed, or tactical nuclear missiles used to vaporise deep under ground infrastructure. Iranian Response Iran will have also been under taking war gaming scenarios in which respect witnessing Israel diminishing its capability to respond following an Israeli air attack, Iran may conclude that an Israeli attack were imminent and therefore may choose to strike first before Israel attacks. However the problem for an Iranian first strike following an Israeli invasion of Lebanon is that it would draw the United States into the unfolding war, in which respect Iran is effectively in a lose, lose situation as the outcome would be the same as Iran's air, missile and nuclear infrastructure would be greatly degraded. However, the advantage of a first strike would be that it would unite an increasingly rebellious population that are suffering as a consequence of hyperinflation behind the Iranian leadership. There is also an alterative scenario that could scupper Israel's attack plans which is if Iran decided to comply with UN resolutions regarding its nuclear programme, for which there is no real sign unless behind the scenes negotiations are taking place, in fact Israel starting to dismantle Iran's capability to deter an Israeli air attack will likely result in an acceleration of the Iranian Nuclear programme as Iran attempts to detonate a series of nuclear tests as a warning against an attack, as we have seen countless times in the past such as at the height of the India / Pakistan confrontation of a decade or so ago. The bottom line is that the Israeli Government had put its military plans on hold until after the US Presidential Election, following which it has now implemented it's 3 stage plan the ultimate goal for which is the destruction of Iran's nuclear infrastructure, towards which it is using the cover of actions in defence of attacks from Gaza that the Israeli elite has engineered as part of a series of war gaming scenarios and plans put together many months ago. These plans have now been put into action and the events in motion suggest that we will first see a Gaza invasion, then of Lebanon, followed by a strike against Iranian nuclear and military infrastructure, all within the next 3 months so as to chime with the January Israeli general election that Prime Minister Netanyahu aims to win. In respect of the consequences for a region wide war, Israel has miscalculated in their rush to implement plans, as they see the country's security being underwritten by the United States therefore have ignored the wider middle eastern, Russia, and China dimensions to a conflict that they seem determined to instigate. For instance we could see that whilst the US is preoccupied in another war in the middle east, that China uses that as an excuse to seize the East China Sea Islands that it disputes with Japan and thus change the whole strategic balance of East Asia / Pacific that the US has dominated since the end of World War 2. Current Probabilities
Every war when it comes, or before it comes, is represented not as a war but as an act of self-defense against a homicidal maniac. - George Orwell Source & Comments: http://www.marketoracle.co.uk/Article37585.html By Nadeem Walayat Copyright © 2005-2012 Marketoracle.co.uk (Market Oracle Ltd). All rights reserved. Nadeem Walayat has over 25 years experience of trading derivatives, portfolio management and analysing the financial markets, including one of few who both anticipated and Beat the 1987 Crash. Nadeem's forward looking analysis focuses on UK inflation, economy, interest rates and housing market. He is the author of three ebook's - The Inflation Mega-Trend; The Interest Rate Mega-Trend and The Stocks Stealth Bull Market Update 2011 that can be downloaded for Free.
Nadeem is the Editor of The Market Oracle, a FREE Daily Financial Markets Analysis & Forecasting online publication that presents in-depth analysis from over 600 experienced analysts on a range of views of the probable direction of the financial markets, thus enabling our readers to arrive at an informed opinion on future market direction. http://www.marketoracle.co.uk Disclaimer: The above is a matter of opinion provided for general information purposes only and is not intended as investment advice. Information and analysis above are derived from sources and utilising methods believed to be reliable, but we cannot accept responsibility for any trading losses you may incur as a result of this analysis. Individuals should consult with their personal financial advisors before engaging in any trading activities.
You're receiving this Email because you've registered with our website. How to Subscribe Click here to register and get our FREE Newsletter To access the Newsletter archive this link Forward a Message to Someone this link To update your preferences this link How to Unsubscribe - this link
The Market Oracle is a FREE Financial Markets Forecasting & Analysis Newsletter and online publication. | ||||||||||||||

Thursday 8 November 2012
Post U.S. Election Market Forecasts for Apple, Gold, Silver, Oil and Stocks
Post U.S. Election Market Forecasts for Apple, Gold, Silver, Oil and Stocks
Chris Vermeulen writes: Over the past two months shares of gold (NYSE:GLD) and Apple (NASD:AAPL) have had a sizable bite taken out of their share price. Active traders along with the longer term investors have had a wild ride this fall watching these investments slide to multi month lows. The big question is when will gold and apple shares bounce? Here we are again with another election behind us and Barack Obama in the White House again. Many think this means four years of the same thing… Printing, Inflation and higher stock prices. Is this good or bad for Americans or the world for that matter? I doubt it, but who really knows and who cares because there is nothing anyone can do about it now. So buckle up your seat belt and focus on trading and investing with major trend both within the United States and abroad using exchange traded funds. Currently the broad stock market and commodities are in a full blown bull market so the focus should be to buy the dips until proven wrong. Below are some charts showing the important breakout levels for Apple, metals, oil and key indexes like the Russell 2000. Be aware that during pullbacks which last more than a month which is the market has done, some of the biggest drops in price happen just before prices bottom… Scaling into positions is the key to minimal draw downs. Apple Inc. – AAPL Stock Chart:Shares of Apple clearly show the down channel which must be broken before investors start buying again. This stock seems to have big potential for $650 to be reached quickly. If Apple shares rise so will the overall stock market… Follow my live charts free here: http://stockcharts.com/public/1992897
Gold Spot – GLD Exchange Traded Fund:During August and September investors flooded the gold market in anticipation of QE3. Since then gold has been drifting lower with profit taking and because of some slowly strengthening economic numbers in the USA. Gold looks ready for a run to the $1800 but may stabilize here for a few weeks first.
Silver Spot – SLV Exchange Traded Fund:The price of silver moves similar to that of its big yellow sister (Gold). While the charts look the same silver is highly volatile and can super charge your portfolio when metals rally.
Crude Oil Spot – USO Fund:Crude oil has been correcting for a couple months also and still has a lot of work to do before a new uptrend to be triggered. Currently oil is trading in the middle of is trading range but once the price breaks above $93 per barrel a good investment fund would be USO.
Russell 2000 Small Cap Index – IWMSmall cap stocks typically lead the broad market in both directions. They are the first to rally and the first to rollover and sell off. The major indexes like the DOW, SP500 and NYSE have not formed clean chart patterns which is why my focus is on the Russell 2000. Small cap stocks are now showing a rising relative strength compared to the SP500 large cap stocks and this is very bullish for stocks in general. The best way to trade this index is through the exchange traded funds IWM and TNA.
Post-Election Trading Breakout Summary:In short, history shows that equities tend to rally after an election. For a detailed outlook of how to trade stocks and indexes during the election cycles be sure to read my report “The Election Cycle – What to Expect in Stocks & Bond Prices” Get my Daily Trading Analysis & Trade Setups at: www.TheGoldAndOilGuy.com By Chris Vermeulen Please visit my website for more information. http://www.TheGoldAndOilGuy.com Chris Vermeulen is Founder of the popular trading site TheGoldAndOilGuy.com. There he shares his highly successful, low-risk trading method. For 7 years Chris has been a leader in teaching others to skillfully trade in gold, oil, and silver in both bull and bear markets. Subscribers to his service depend on Chris' uniquely consistent investment opportunities that carry exceptionally low risk and high return. This article is intended solely for information purposes. The opinions are those of the author only. Please conduct further research and consult your financial advisor before making any investment/trading decision. No responsibility can be accepted for losses that may result as a consequence of trading on the basis of this analysis.
You're receiving this Email because you've registered with our website. How to Subscribe Click here to register and get our FREE Newsletter To access the Newsletter archive this link Forward a Message to Someone this link To update your preferences this link How to Unsubscribe - this link
The Market Oracle is a FREE Financial Markets Forecasting & Analysis Newsletter and online publication. | |||||||||||||


Monday 5 November 2012
U.S. Presidential Election Forecasts From Academics, Market Analysts and Mainstream Press
U.S. Presidential Election Forecasts From Academics, Market Analysts and Mainstream PressStocks Stealth Bull Market 2011 Ebook Direct Download Link (PDF 2.8m/b) Interest Rate Mega-Trend Ebook Direct Download Link (PDF 2.3m/b) Inflation Mega-Trend Ebook Direct Download Link (PDF 3.2m/b) Dear Reader The opinion polls continue to paint a picture of a close race between Obama and Romney going into the final two days of campaigning ahead of Tuesdays election. However all the opinion polls with large margins of error of + /- 3% are further complicated by the electoral college votes system which means that the polling is increasingly focused on a handful of swing states such as Ohio, Florida, Iowa, Wisconsin and New Hampshire, making it virtually impossible to gauge the probable election outcome by looking at these polls, thus the general public is looking towards informed opinions of academics with their back tested models (Uni Professors), market analysts (me), and mainstream media (such as News Papers), therefore this article seeks to present the views from each category in terms of evaluating the probable election outcome.
Market Analysts / Traders My own view as an analyst/trader who has approached the US Presidential Election in terms of a market to determine the most probable outcome, and therefore I have been more focused on market moving events, which has led me to conclude since Mid September 2012 that Obama would win the election and further more since 6th October 2012 that Obama would win by more than 300 votes, and subsequent events have in net terms not changed this expectation. In fact were I active in this market (U.S. Presidential Elections), then I would have put my own money on the line as clearly following Obama's handling of the hurricane Sandy disaster, the probability for an Obama win should have increased further. 19 Sep 2012 - The Day Mitt Romney Lost the U.S. Presidential Election 2012, Youtube Fund Raising Video After Mondays debacle, Romney has fatally crippled himself and is destined to lose the November election. 06 Oct 2012 - High U.S. Unemployment Rate, Obama Failure or Bush Catastrophe for Romney to Continue? Therefore many american's may be surprised on election night when the results start coming in that point to a relatively strong Obama election win of more than 300 Electoral votes. 27th Oct 12 - Who Will Win the U.S. Presidential Election, Forecast 2012 My forecast remains for President Obama to be re-elected on November 6th with the probability favouring more than 300 electoral votes. 01 Nov 2012 - Hurricane Sandy Impact on U.S. Presidential Election 2012 The momentum is firmly behind Obama going into the final days of campaigning that not even a relatively bad jobs report tomorrow (Nov 2nd) will have enough time behind it for momentum to reverse this trend. Ironically, the long term impact of Sandy will be to create jobs and stimulate the U.S. economy as damaged and destroyed homes and infrastructure will need to be rebuilt. Intrade - Barack Obama to be re-elected President in 2012 A search for an actual market for the US presidential election has led me to Intrade that basically allows market participants to trade the US election. However when one considers such a market, one needs to look at the volume of activity for the greater the volume in the market then the greater the probability of the probable outcome. In this respect Intrade over the past month is showing a pick up in the volume from 20,000 per day to as high as 150,000 per day. The current expectation puts Obama on a 64% probability of a win in terms of market expectations of several hundred thousand participants which is well beyond the scope of opinion polls, all with the added bonus that these market participants have actually put money on the line so are less influenced by political bias but rather veering more toward what is actually the more probable outcome.
Again, a word of caution for those seeking to relying on such markets for outcomes because the vast majority of markets offered are highly illiquid and thus not giving a reliable price / probability of outcome, as one is unable to trade at the indicated prices because there is no counter party available to fill an order any where near the quoted price. Academics The Daily Mail published a a story that a computer model by two professors at the University of Colorado forecast a Romney win of 320 votes with Obama losing on 218 as excerpted below: Daily Mail - Bad news Barack: Electoral College computer model that's correctly predicted presidential elections since 1980 shows big WIN for Romney A model which has foretold the correct results of the Electoral College selections in U.S. Presidential elections since 1980, has predicted a loss for Barack Obama and the Democratic Party. The forecast was made by two professors at the University of Colorado who used economic data and unemployment figures from each state to predict a Republican win come November. Political science professors Kenneth Bickers and Michael Berry’s study predicts 218 electoral votes for President Obama and 320 for Romney with the Republican candidate winning every seat currently considered to be on the fence. If you have any experience of my writings then you will know my view of academic theories and models as being more or less worthless, as they live in ivory towers creating intricate back tested models that FAIL over 90% of the time going forward, as every experienced market trader knows, you CANNOT TRADE FORWARD on the basis of BACKTESTED models! It just does not work in the real world, instead systems have to be adaptive and skewed in favour of the most recent data. US Mainstream Media - Highly Polarised Propaganda The US media map is highly polarised and biased in favour of a particular candidate, for instance many of the news papers have been biased right from the beginning of the campaign and the same holds true for broadcast news as we see with the likes of Fox News which is clearly Republican in output and MSNBC which is clearly Democrat. Instead in the UK the broadcast news channels are not discernibly biased in a particular direction and to a lesser extent British newspapers that can and do switch their allegiances between political parties only making their support public in the final week or so before each election. Therefore the US election is highly polarised in terms of media output that we just do not experience in the UK. There is far more ms-information pumped out in the US media about each opponent, so I am not surprised that the general population is fearful of either outcome, whereas in the UK most of the people understand that there is little difference between Conservatives or Labour and therefore tend to be more detached from the politicking that goes on and not let themselves be built up into a frenzy of fear and loathing. Looking at the US media sphere, some of the more credible 'independant' papers have made their intentions known at a late stage are - America could do better than Barack Obama; sadly, Mitt Romney does not fit the bill The devil we knowWe very much hope that whichever of these men wins office will prove our pessimism wrong. Once in the White House, maybe the Romney of the mind will become reality, cracking bipartisan deals to reshape American government, with his vice-president keeping the headbangers in the Republican Party in line. A re-elected President Obama might learn from his mistakes, clean up the White House, listen to the odd businessman and secure a legacy happier than the one he would leave after a single term. Both men have it in them to be their better selves; but the sad fact is that neither candidate has campaigned as if that is his plan. As a result, this election offers American voters an unedifying choice. Many of The Economist’s readers, especially those who run businesses in America, may well conclude that nothing could be worse than another four years of Mr Obama. We beg to differ. For all his businesslike intentions, Mr Romney has an economic plan that works only if you don’t believe most of what he says. That is not a convincing pitch for a chief executive. And for all his shortcomings, Mr Obama has dragged America’s economy back from the brink of disaster, and has made a decent fist of foreign policy. So this newspaper would stick with the devil it knows, and re-elect him. New York Times - Back Obama for Re-election The New York times has recently thrown its hat behind the Barack Obama giving a string of reasons from economic recovery, foreign affairs and Obamacare. For these and many other reasons, we enthusiastically endorse President Barack Obama for a second term, and express the hope that his victory will be accompanied by a new Congress willing to work for policies that Americans need. The New York TImes - New York Times Endorsements Through the Ages I had been assuming that the New York Times would be a relatively independant voice as illustrated by waiting to throw their hat in towards the end of the campaign, however they have also published an interesting piece which shows the Times endorsements for the presidency since 1860 to the present. As the below graphic illustrates, the New York Times stopped being impartial in 1960 since which time it has ONLY picked democrat candidates, and thus their accuracy has been 46% (less than a coin toss) due to a clear inbred political bias against Republicans and in favour of Democrats which illustrates the tendency of US media sphere to be highly polarised.
I could try to find an impartial U.S. media source but I don't think I will be able to do so. Instead a look at the UK media-sphere such as the Telegraph does not show a clear statement in favour of either candidate, just coverage of political events and opinion polls that conclude in Obama on 48% and Romney on 47%. However another poll published in the Sunday Times suggests 70% of Britons would vote for Obama, and just 7% would back the Republican candidate. So perhaps those living in the UK are exposed to more subtle pro Obama propaganda than the more overt in your face propaganda that takes place in the US? The sum of this article taking account of academics who are wrong over 90% of the time, market analysts who have an monetary incentive to be right (as they actually put money on the line) and relegating the highly bias US media-sphere and pro Obama UK media, then the probability still continues to favour an Obama win, though perhaps the race is marginally closer than I had concluded earlier, we shall soon find out. If the election were not complicated enough we also have a string of conspiracy theories to contend with such as centring around voting machines. With stories along the lines of the 2000 election of the hanging shads. Specifically that Mitt Romney son's private equity firm has a stake in the provider of Ohio's voting machines as illustrated by comments by MSNBC's Jennifer Brunner "It doesn’t look good for a presidential candidate’s son to be an investor in a voting machine company.”, if true (and I doubt it), it would put a new spin on the rich buying votes. Source and comments - http://www.marketoracle.co.uk/Article37332.html By Nadeem Walayat Copyright © 2005-2012 Marketoracle.co.uk (Market Oracle Ltd). All rights reserved. Nadeem Walayat has over 25 years experience of trading derivatives, portfolio management and analysing the financial markets, including one of few who both anticipated and Beat the 1987 Crash. Nadeem's forward looking analysis focuses on UK inflation, economy, interest rates and housing market. He is the author of three ebook's - The Inflation Mega-Trend; The Interest Rate Mega-Trend and The Stocks Stealth Bull Market Update 2011 that can be downloaded for Free.
Nadeem is the Editor of The Market Oracle, a FREE Daily Financial Markets Analysis & Forecasting online publication that presents in-depth analysis from over 600 experienced analysts on a range of views of the probable direction of the financial markets, thus enabling our readers to arrive at an informed opinion on future market direction. http://www.marketoracle.co.uk Disclaimer: The above is a matter of opinion provided for general information purposes only and is not intended as investment advice. Information and analysis above are derived from sources and utilising methods believed to be reliable, but we cannot accept responsibility for any trading losses you may incur as a result of this analysis. Individuals should consult with their personal financial advisors before engaging in any trading activities.
You're receiving this Email because you've registered with our website. How to Subscribe Click here to register and get our FREE Newsletter To access the Newsletter archive this link Forward a Message to Someone this link To update your preferences this link How to Unsubscribe - this link
The Market Oracle is a FREE Financial Markets Forecasting & Analysis Newsletter and online publication. | ||||||||||||||