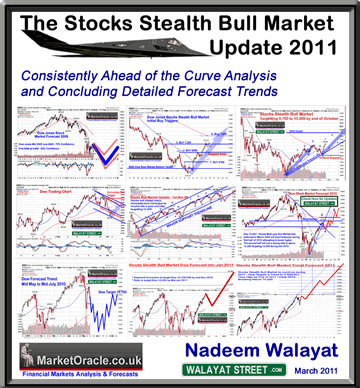
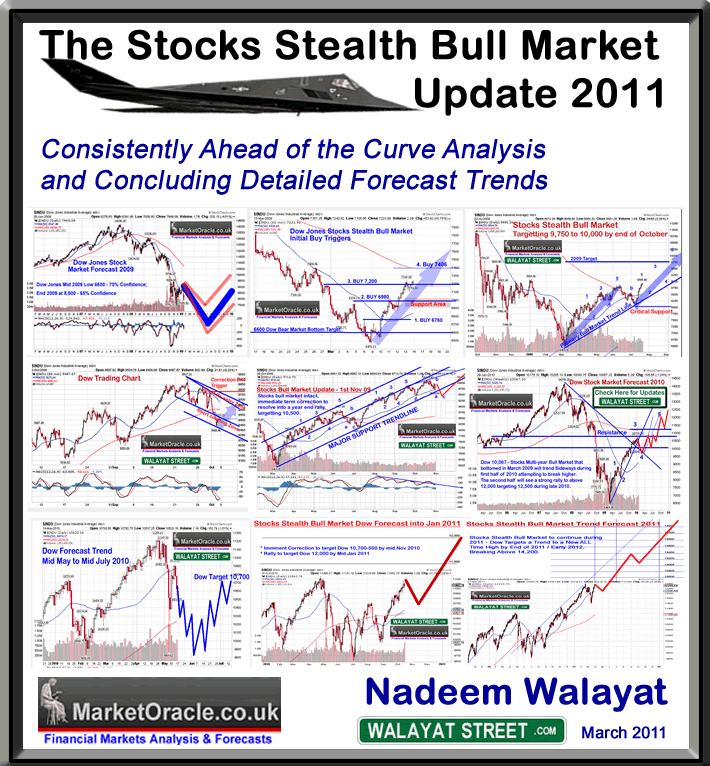
The Stocks Stealth Bull Market Update 2011 EbookStocks Stealth Bull Market 2011 Ebook Direct Download Link (PDF 2.8m/b) Interest Rate Mega-Trend Ebook Direct Download Link (PDF 2.3m/b) Inflation Mega-Trend Ebook Direct Download Link (PDF 3.2m/b) Dear Reader The New The Stocks Stealth Bull Market Update 2011 70 page ebook is now available for FREE Download. This ebook follows on from the 3rd of April 2011 publication of key analysis and concluding trend forecast for the DJIA stock index for 2011 (Stocks Stealth Bull Market Trend Forecast 2011), that includes the full detailed analysis and additional trend forecasts for the following major world stock market indices : UK FTSE100, China SSEC, India BSE and Russia RTSI. Download Now- The Stocks Stealth Bull Market Update 2011 Ebook (PDF 2.8meg)- Minimum requirement Adobe Reader V7 or higher which is available for free at adobe.com
CONTENTS
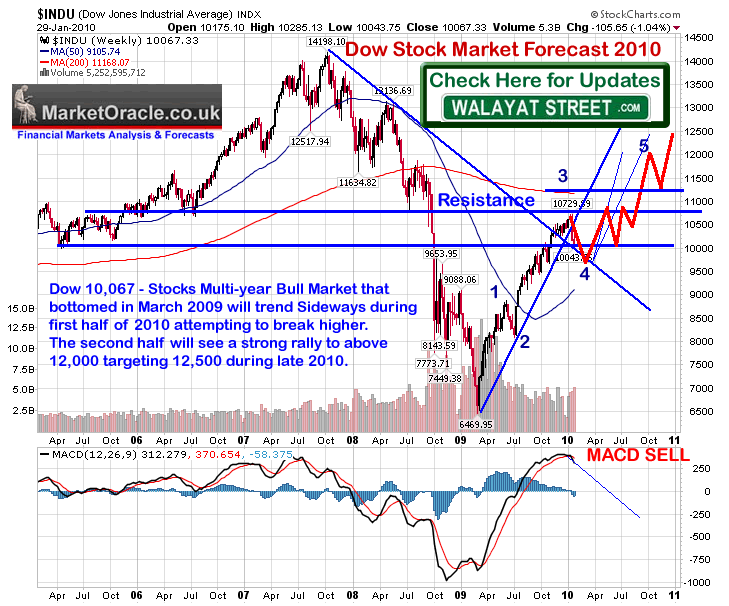
Recap of Stock Market Trend Forecast for 2010 - 02 Feb 2010 - Stocks Stealth Bull Market Trend Forecast For 2010 Dow 10,067 - Stocks Multi-year Bull Market that bottomed in March 2009 will trend Sideways during first half of 2010 attempting to break higher. The second half will see a strong rally to above 12,000 targeting 12,500 during late 2010.
Source and Comments: http://www.marketoracle.co.uk/Article27511.html By Nadeem Walayat Copyright © 2005-2011 Marketoracle.co.uk (Market Oracle Ltd). All rights reserved.
Disclaimer: The above is a matter of opinion provided for general information purposes only and is not intended as investment advice. Information and analysis above are derived from sources and utilising methods believed to be reliable, but we cannot accept responsibility for any trading losses you may incur as a result of this analysis. Individuals should consult with their personal financial advisors before engaging in any trading activities.
You're receiving this Email because you've registered with our website. How to Subscribe Click here to register and get our FREE Newsletter To access the Newsletter archive this link Forward a Message to Someone this link To update your preferences this link How to Unsubscribe - this link
The Market Oracle is a FREE Financial Markets Forecasting & Analysis Newsletter and online publication. | ||||||||||||||||||||||||||||||||||||||||||||||||||||||||||||||||||||||||||||

Wednesday 13 April 2011
The Stocks Stealth Bull Market Update 2011 Ebook
Tuesday 5 April 2011
Stocks Stealth Bull Market Trend Forecast 2011
Stocks Stealth Bull Market Trend Forecast 2011Interest Rate Mega-Trend Ebook Direct Download Link (PDF 2.3m/b) Dear Reader The stocks stealth bull market passed its second anniversary this month (March 2011), having trended from trough to peak on the Dow Jones Industrial Averages stock Index from 6470 to 12,400, a gain of over 91%. This in-depth analysis seeks to formulate a concluding trend forecast for the remainder of 2011 and into early 2012 (over 9 months). Whilst this article contains key analysis and the concluding trend forecast, the full analysis and implications of are contained within NEW FREE Stocks Stealth Bull Market Update 2011 Ebook, that will be made available for download within the next few days, ensure you are subscribed to my ALWAYS FREE Newsletter to get access to the FREE ebook download.
The reason why the bull market in stocks remains a STEALTH bull market because it has been missed by most, only a few have ridden and profited from it since its birth 2 years ago as it continues to be predominantly referred to by the financial press and BlogosFear as a "bear market rally" who's end is envisaged ON EVERY correction, and I don't even need to go looking for such commentary because my email in box is literally full of such adamant conclusions, for instance only the other week an email from a prominent mainstream financial magazine was titled "The bull market is over – we’re in a bear market now", which was at virtually the exact point that the correction ended. The bottom line is that much of the analysis that you read in the financial press and blogosfear is not analysis at all, but rather propaganda in support of a pre-existing conclusion which is therefore following a completely irrational thought process which is why whole bull and bear markets can not only be missed but consistently bet against. 2009 - Birth of the Stocks Stealth Bull Market See Stocks Stealth Bull Market Ebook (FREE DOWNLOAD) 2010 - Bull Market Consolidates and Targets Dow 12,000 2010 was the year for stock market consolidation with an upward bias, which has repeatedly given the bears plenty of rope to hang themselves with. During 2010 I published 4 in depth stock market analysis and concluding forecast trends as listed here: 1.... 02 Feb 2010 - Stocks Stealth Bull Market Trend Forecast For 2010 - The Inflation Mega-Trend Ebook Page 82 (FREE DOWNLOAD) Dow 10,067 - Stocks Multi-year Bull Market that bottomed in March 2009 will trend Sideways during first half of 2010 attempting to break higher. The second half will see a strong rally to above 12,000 targeting 12,500 during late 2010.
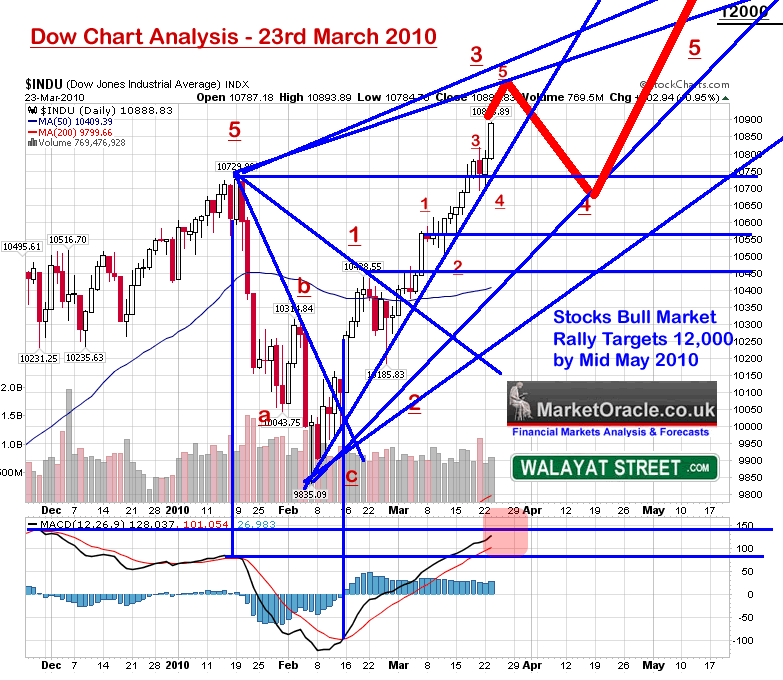
2... 23 Mar 2010 - Stocks Stealth Bull Market Trend Forecast Into May 2010 Dow (DJIA) March to May Stock Market Trend Forecast Conclusion - Therefore my specific conclusion is for a continuation of the uptrend into early to mid May, achieving the 12,000 target during this time period, also allowing for a correction during April.
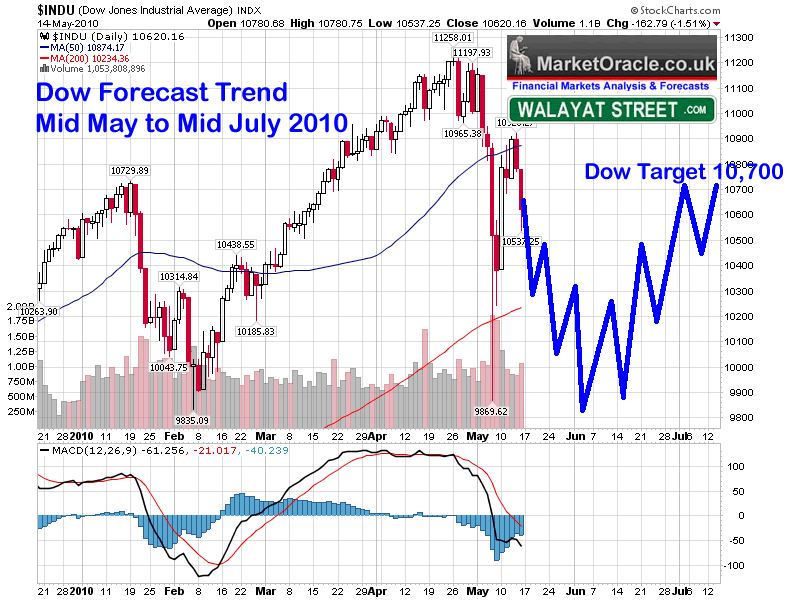
3... 16 May 2010 - Stocks Bull Market Hits Eurozone Debt Crisis Brick Wall, Forecast Into July 2010 This correction could last for several months and may extend all the way into early October, which suggests that the next 2 months are going to see an ABC correction to be followed by a sideways price action between the extremes of 10,900 to 9,800 and so despite continuing wild gyrations I would not be surprised if the Dow is little changed from its last closing price of 10,620 in 2 months time (16th July 2010). Expectations remain for the bull market to resume its trend towards a target of between 12k to 12.5k by late 2010 after the tumultuous trading period over the next few weeks. I have tried to illustrate a more precise Dow forecast projection in the below graph, reality will probably end up being far more volatile.
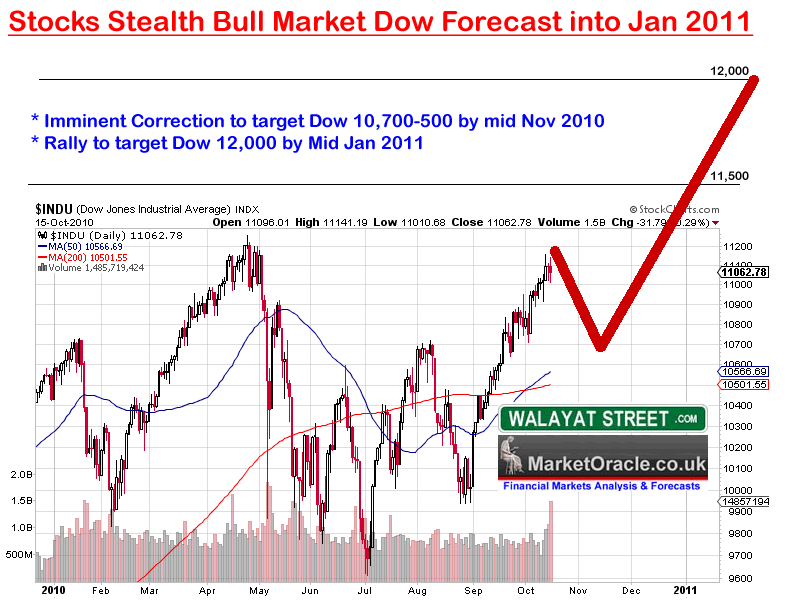
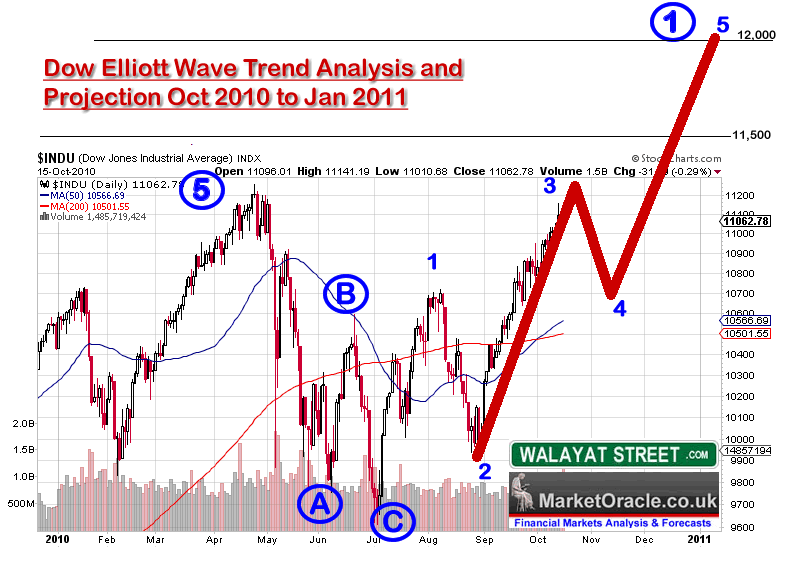
4... 18 Oct 2010 - Stocks Stealth Bull Market Dow Trend Forecast into Jan 2011 STOCK MARKET FORECAST FINAL CONCLUSION Everything appears to be in synch! All of the above (and linked) analysis together lead me to the following trend conclusion for the stock market as measured by the DJIA30 index - The Stock market is heading for an imminent correction which means it may not be able to reach resistance at 11,250 before correcting which targets a trend to 10,700-10,500 by mid November, that I expect to resolve in an uptrend into January 2011 that targets Dow 12,000 as illustrated by the below graph, and therefore confirms the original forecast target for the Dow as of January 2010. Also an interim analysis for 2011 suggests that the Bull run could continue into May/June 2011.
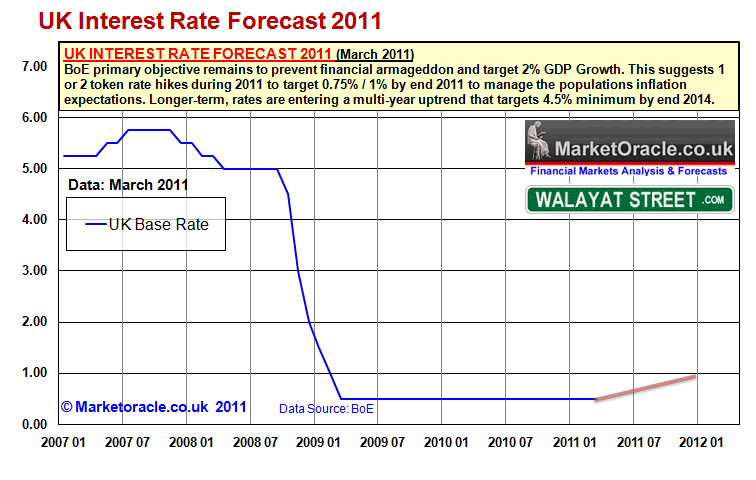
Interim Update - 31 Jan 2011 - Dow Jones Stock Market Index Reverses at 12,000 Target The Stock market to large extent achieved its trend expectations for 2010 including the target to hit 12,000 during late January 2011, that signaled that a significant correction was imminent to target a drop of approx 10%. Bear Market Rally Mantra Repeatedly Busted See Stocks Stealth Bull Market Ebook (FREE DOWNLOAD) Rising Interest Rates Implications for the Stock Market The consensus view as continuously pumped out in the mainstream financial press and further regurgitated at length in the blogosfear is that rising interest rates will negatively impact upon stock price trends due to higher yielding bonds competing against stock dividend yields as well as acting to suppress economic activity and therefore corporate earnings growth. However much of this consensus view is perpetuated by highly public perma-bears who have consistently wrongly called for the demise of the stocks bull market of the past 2 years, as they continue to call for an always imminent end of the so called 'bear market rally' despite the fact that the past 2 years has witnessed one of the greatest bull runs in history. Therefore increasing prospects for a rise in interest rates from record lows as a consequence of bailing out the bankrupt banking sector has prompted the perma-bears to perpetuate the consensus view that rising interest rates will be bad for the stock market which this analysis seeks address. Interest Rate Trend Forecast My recent in-depth analysis (Interest Rate Mega-Trend Ebook) concluded in the UK's Bank of England acting on only 1 or 2 token rate rises during 2011, as any more would put their bankster brethren under pressure and increase the risk of financial armageddon.
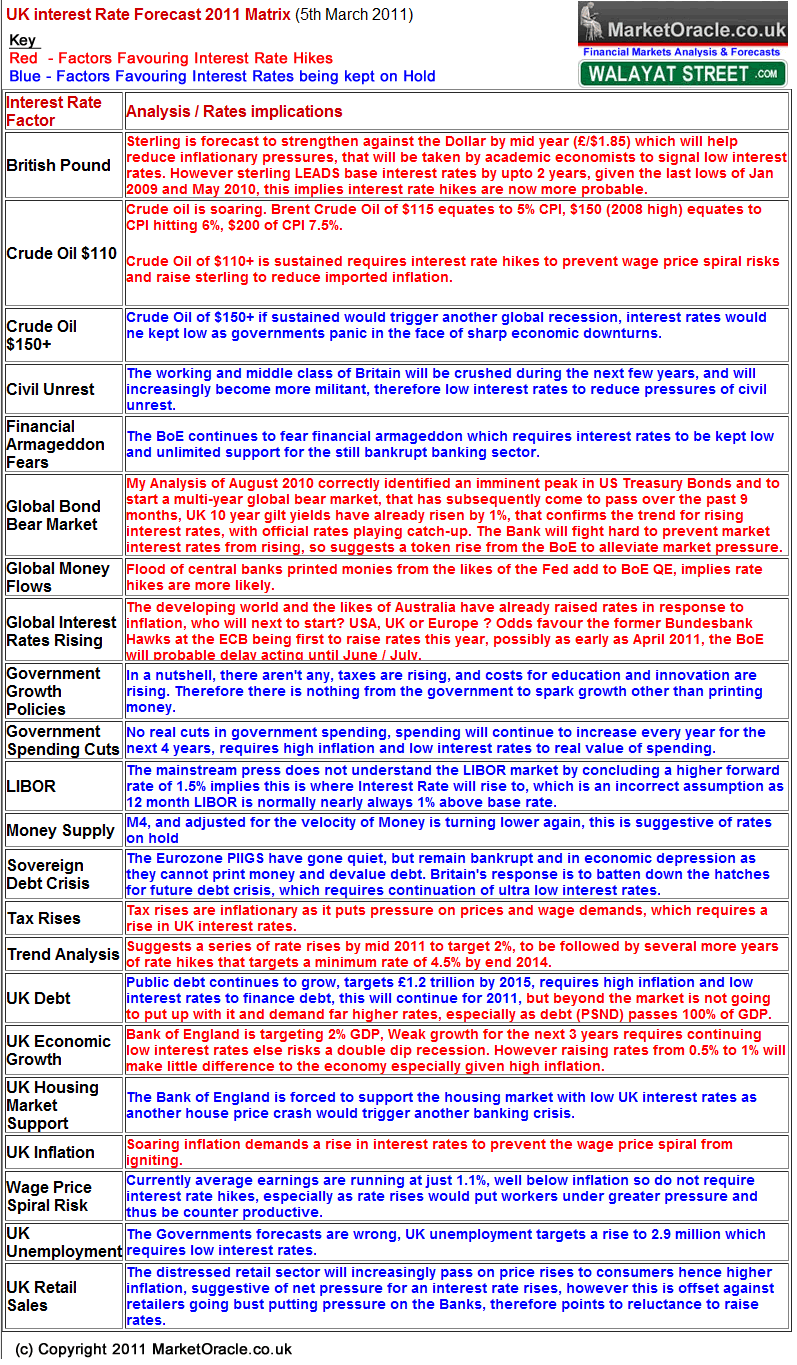
The lengthy interest rate analysis has been condensed into the below matrix
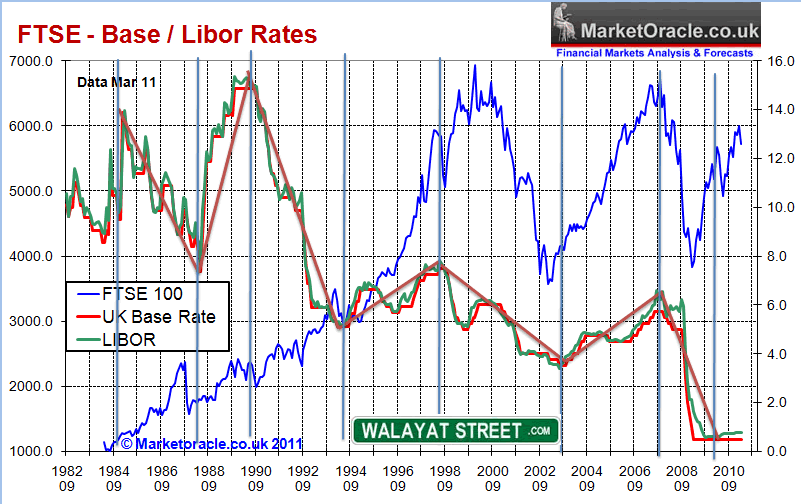
UK Base Interest Rates and the FTSE 100 Index The below graph illustrates the trend relationships between the UK FTSE 100 Index, base interest rate and 3 Month LIBOR.
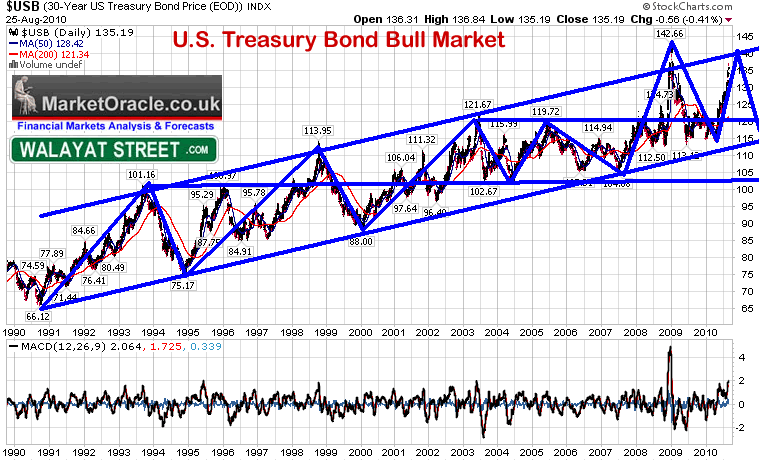
The key point is that there is a greater probability for rising stock prices when interest rates are rising then when interest rates are falling (the exact opposite of the consensus view). Stock markets tend to bottom and enter into a bull market long before interest rates start to rise, which makes sense in that stock markets are a risk based leading indicator of economic activity whereas central banks are nearly always acting behind the curve to curb the consequences of having kept interest rates too low for far too long and thus have over stimulated the economy as we have witnessed with the Bank of England paralysis on UK interest rates for the past 2 years. Therefore on its own, the UK base interest rate rising will have no effect on the current stocks bull market. Instead the key danger for the stock market will be when market commentators start to contemplate when interest rates should be cut, the good news is that we are many years away from such a situation which will follow a trend of rising interest rates, followed by an interest rate plateau before rates are again cut, which the mainstream press will at that time wrongly conclude as positive for the stock market. The Dow and U.S. Interest Rates My in-depth analysis of near 9 months ago during August warned of the U.S. Treasury bond bubble that was primed to burst and enter into a multi-year bear market (26 Aug 2010 - Deflation Delusion Continues as Economies Trend Towards High Inflation ) since which time US bonds have fulfilled the initial bear market trend as illustrated by the below forecast graph that has quite closely matches the actual outcome that also implied technical bounce would take place from the support area of 115-118 (currently underway).
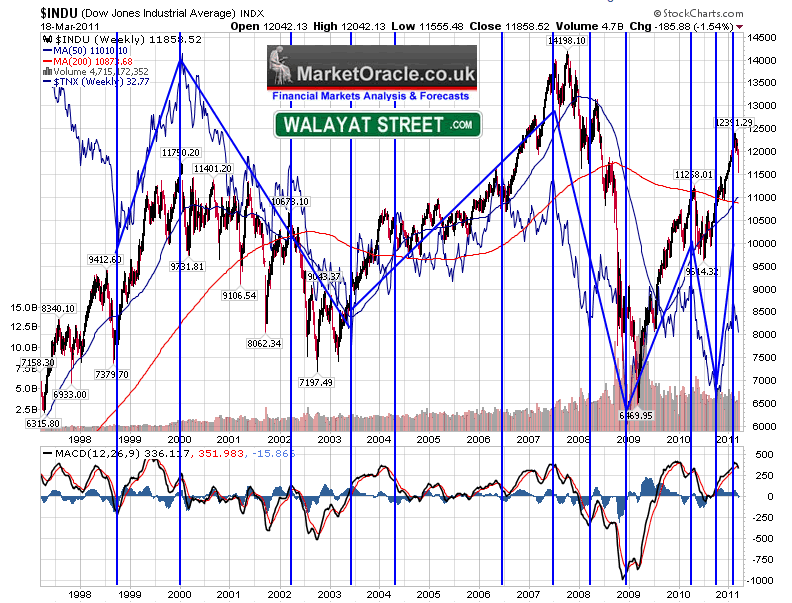
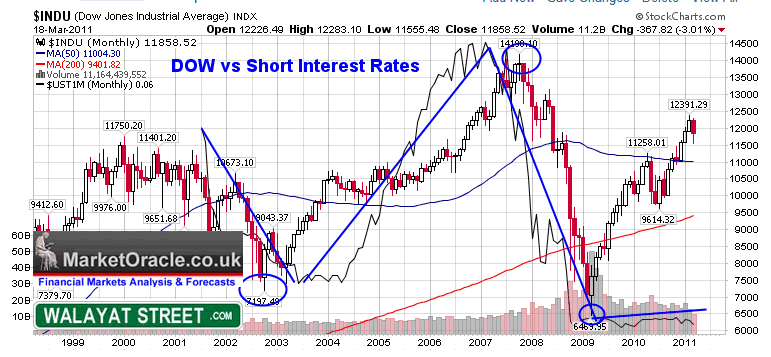
Dow Consensus Interest Rates Myth Busted The long-standing widely held consensus view that rising interest rates are bearish for stocks and falling interest rates are bullish, has many concluding that rising U.S. interest rates will be bearish and thus act as another in a series of busted triggers for the long called for bear market to resume. U.S. 10 Year Rates
The above graph illustrates that rising long yields are accompanied by rising stock prices and falling long yields are accompanied by falling, stock prices after a lag of upto 6 months. U.S. Short Rates
The above graph illustrates that rising short yields are accompanied by rising stock prices and falling yields are accompanied with falling, stock price trends (after a lag). The U.S. Interest rate and Dow analysis confirms the earlier FTSE analysis that stock market rallies LEAD interest rates higher rather than interest rates leading stocks which is again another consensus myth that does not match reality. The reason for this is because generally rising interest rates are a sign of a strengthening economy, and falling interest rates are a sign of a weakening economy and thus stocks react BEFORE evidence of economic strength or weakness materialises which is when interest rate decisions are taken as a lagging action. This implies that RISING interest rates WILL NOT HAVE A NEGATIVE IMPACT on the stock market as the STOCK MARKET LEADS INTEREST RATES HIGHER.
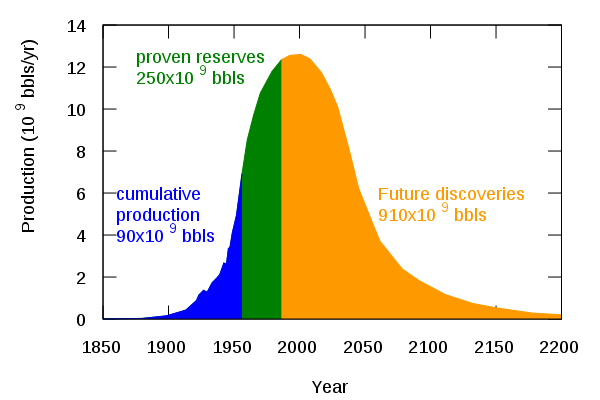
Bottom Line - Rising interest rates are generally bullish for the stock market and given the fact that official interest rates have yet to rise is suggestive of a continuation of the stocks bull market for some time (on the interest rate measure). Crude Oil Price Impact on Stock Market Trends Whilst the mainstream press as ever looks in the rear view mirror to pick events as reasons for the rise in the oil price, such as the ongoing breakout of freedom in the middle east, however as stated in the January 2010 Inflation Mega-trend ebook (FREE DOWNLOAD) and updated below, the consequences of peak oil ensures an escalator effect for the ramping up of oil prices into ever higher trading ranges that will one day make today's high oil prices look cheap, as oil prices continue a volatile mega-trend to north of $200 per barrel. Oil Price Inflationary Mega-trendCrude oil is both a major driver and beneficiary of the inflation mega-trend because during times of high inflation or expectations of future high inflation the highly liquid crude oil market is utilised to both hedge against and speculate in favour of future inflation, thus one could say illustrates the self full-filling prophesy at work as witnessed during 2008 that saw inflation hedging result in a surge in the crude oil price to $148, which had the effect of dragging inflation higher, only to crash as a consequence of the financial crisis which continued into the deflation of late 2008 and early 2009. In addition to its inflationary impact, crude oil is also subject to Peak Oil, which the next section touches upon. Peak Oil Mega-trend Firstly, Peak Oil does not mean that the world is running out of oil any time soon, peak oil means that the world is about to pass the point of maximum rate of production after which production is expected to decline as it becomes ever more costly to find and extract new oil fields thus resulting in diminishing supply. The theory of Peak Oil is based on the principle originally developed by M King Hubbard in the 1950's, who observed the rate of production and depletion of oil output from the United States oil fields over time which culminated in a bell shaped curve. M King Hubbard went on to use his findings to accurate predict that U.S. oil production would peak by 1970 and decline rapidly. The below updated graph illustrates the most recent forecast projection for global Peak Oil which implies that the supply output peak is imminent, where the test will come when supply fails to respond to rising demand as the worlds economies return to trend growth.
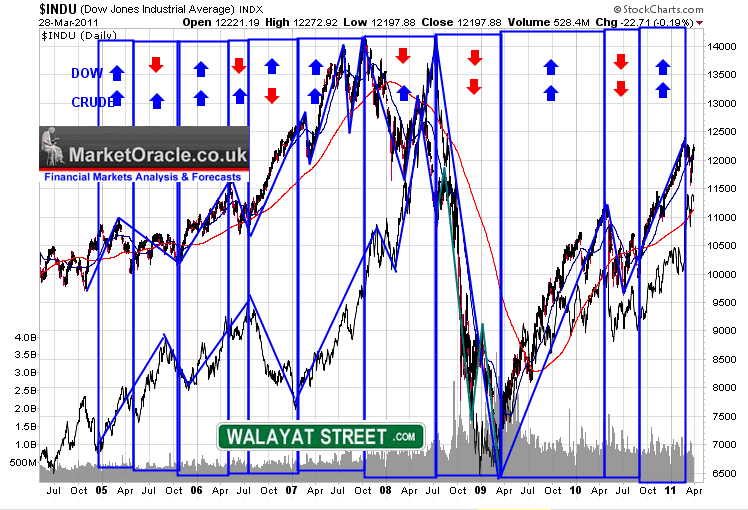
http://en.wikipedia.org/wiki/File:Hubbert_peak_oil_plot.svg Whilst the developed world continues to stabilise and in some cases cut back on total oil consumption due to improvements in technology and switch to renewable's and alternatives such as natural gas. However much of the reduced western oil demand (ignoring the recession) for oil consumption can be attributed to the exporting of industrial production abroad to China and India, which remain several decades away from reaching the level of West in terms of stabilisation of consumption as the collective total of 2.5 billion people of both countries consume on a per capita basis less than 10% of that of the average western person. Peak Oil is a reality, the major cheap oil fields across the big producing nations have already passed their peak outputs and are declining fast in output and where discoveries of new economically recoverable reserves are not keeping pace with. We got a taste of the consequences of peak oil during 2008 when Crude oil soared to $147, where a small shift in the supply demand balance can cause extreme shifts in price as MARKET SENTIMENT (speculators) drives prices into ever increasingly volatile price trends. Therefore, oil and energy commodities despite continuing to exhibit high price volatility over the next 10 years, will still result in an rising trend curve as the oil price escalator repeatedly moves to ever higher trading ranges, therefore I expect we will continue to see extremely high price volatility in the region of 50% as speculative funds continue to dominate short-term trends in the highly liquid crude oil markets, which the long-term inflationary mega-trend (as a consequence of emerging markets growth, population growth and fiat money printing) continues to force oil prices ever higher. Oil Price Impact on the Stock MarketThe consensus view as iterated on a near daily basis in the mainstream press and on the internet is that rising oil prices are generally bearish for the stock market, and falling oil prices are generally bullish. However, the below graph of the Dow and Crude Oil price illustrates that most of the time the oil price and the stock market (Dow Jones index) can be expected to trend in the same direction. This clearly implies that most of the time a rising oil price is associated with economic growth and thus rising future prospects for corporate earnings are discounted by rising stock prices. Whereas a falling oil price is associated with weaker future economic activity and thus implies lower future corporate earnings which is again discounted in the present.
As mentioned earlier, rising oil prices are part of an inflationary mega-trend, which means that as higher oil prices trend higher, the associated costs can be expected to be passed into consumers in an orderly manner, thus the peak oil mega-trend is bullish for nominal stock prices. The only fly in the ointment is that as illustrated by the oil price trend during the first half of 2008, when there was a serious divergence between the stock market and the oil price as mania gripped the market that sent inflation soaring, and thus as the oil price soared the stock market entered into a severe bear market. However this divergence did not persist as oil price bubble burst sending the oil price literally crashing lower, playing catch up to the stocks bear market into the March 2009 low. Conclusion A rising trend for oil prices is bullish for the stock market as long as it does not involve a parabolic mania driven spike that is likely to kill future economic demand and is thus discounted in the present by the stock market trending lower, with the oil prices soon catching up to the stock price decline as occurred during the second half of 2008. The current situation with oil prices hovering just above $100, is not bearish for the stock market as long as the oil price does nothing more than just trend higher rather than enter into a mania driven spike for instance to say $150 by mid summer, therefore a gradual uptrend is unlikely to impact negatively on the stock market. Inversely a weak oil price is likely to be bearish for the stock market. However the current outlook is at worst suggestive of oil prices consolidating before trending higher and therefore continue to support a bullish outlook for stock prices. The Copper Price and the Stock Market Trend See Stocks Stealth Bull Market Ebook (FREE DOWNLOAD) Stocks Stealth Bull Market Elliott Wave Analysis My unorthodox interpretation of Elliott Wave Theory has proved highly accurate for the duration of the stocks stealth bull market from its birth in March 2009 in gauging the probable trend for the Dow for the past 2 years, in that there are no hard and fast rules, no tenants, no absolutes that the price must obey as per theory, because in the real world the price action is the master not theoretically what the price action should do which is why over zealot proponents of elliott wave theory have missed the whole stocks bull market, instead of which the theory is just that, a theory, so should bend or even break in the face of real time price action and not engage in the exercise of ever expanding hindsight based pattern fixing. My last in depth analysis (18 Oct 2010 - Stocks Stealth Bull Market Dow Trend Forecast into Jan 2011) concluded that the stock market was about to complete a 3rd wave high to be followed by a wave 4 correction before a wave 5 rally to Dow 12000 during January 2011 as illustrated by the below original chart.
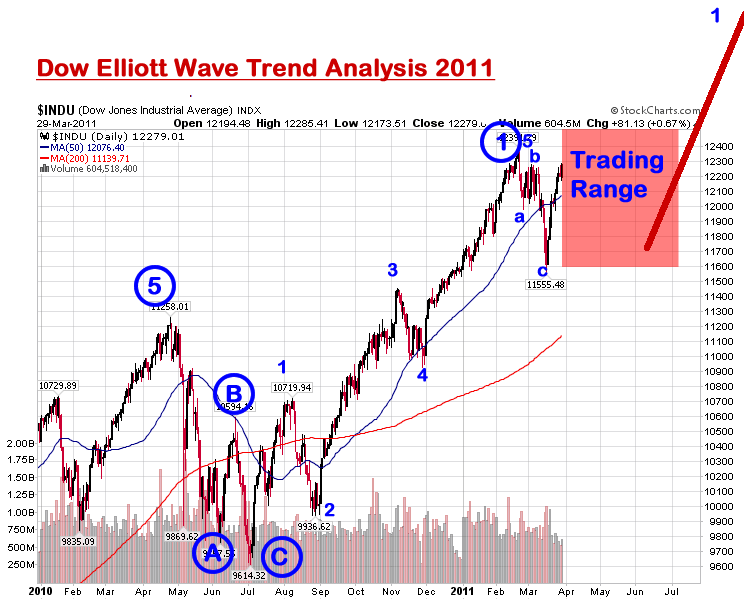
Subsequent price action showed that elliott waves played an important part in arriving at an accurate final trend forecast conclusion. Elliott Wave Price & Time Analysis Carrying over the wave pattern conclusion from the last analysis of October 2010, which implied that the forecast 5th wave peak would resolve in a significant correction of approx 10% that sought to correct the whole move from the July 2010 low that has subsequently come to pass. Current EW Analysis -
On face value the above EWT analysis resolves in the correction being over and that the stock market has now entered into a strong bull run to form a powerful Wave 1 rally that could last another 2 months or so. The problem is that this resolution in EWT price pattern is too neat and tidy, rather too obvious, which suggests to me that the probability of it transpiring is less than 50%. So how would the bears interpret the EWT price action ? Obviously that every market high is the final fifth, this would imply that the major wave 5 was instead an A and major C was wave B and Major 1 is a C so once more terminating the so called bear market rally much as the April 2010 high was end of the bear market rally as was virtually every prior peak. Will the stock market be devious and give the bears some more rope to hang themselves with as well as put doubt into the bulls minds ? Such price action would be suggestive of a trading range which both fails to break higher and break lower, thus each time the Dow trades near the extremes of the trading range then it will accumulate more bull and bearish positions as each become more vocal in the certainty of the outcome at the extremes and thus preparing the way for a powerful breakout. Off course since we are in a stocks stealth bull market probability favours the breakout direction to be to the upside. The question mark is what kind of price pattern could generate such a trend ? That of a sideways volatile trading range before a breakout higher, to be blunt it's not important because it will only become clear in HINDSIGHT, when many analysts will use their rear view mirrors once more to have seen it all along with crystal clarity regardless of the actual facts. Elliott Wave Conclusion
My interpretation of EWT suggests that the correction is going to morph into a trading range with an upward bias as the stock market attempts to break higher and thus there will be likely plenty of ziga ziga ah-ing Spice Girls style along the highs over the coming months to confuse the absolutists wave counts of both bulls and bears that will only become clear in hindsight. The overall trend of a trading range (with false upside breakouts more probable than downside breaks) that at least extends into Mid May and possibly all the way into July could look rather messy and be full of nasty whipsaws that would punish both the bulls and bears before the stock market sustains a breakout higher. The only question mark is when will the stock market break higher which my ongoing in-depth analysis will seek to resolve towards a final trend conclusion for the remainder of 2011 which this EWT analysis forms a mere part of. However it cannot be denied that the current rally is strong and impulsive in nature so the alternative is that this time EWT will work like clock work and generate an far easier pattern for the bulls at least to interpret and act upon which suggests a strong bull run into Mid May to well beyond the last bull market high of 12,391, that will once more leave the perma-bears end of the bull market calls busted once more, before the stock market enters into a summer correction (Sell in May and Go Away). Bottom line - There is nothing in EWT to suggest that the 2 year bull market is ending, if anything EWT implies stocks have another year of gains ahead of them. Immediate future is less certain, and leads me towards a volatile trading range with an upward bias into at least mid May and as late as early July in advance of sustained bull run out of the range. So perma-EWT bears can be expected to suffer from another year of amnesia as they scramble to re-invent another year of busted bear market calls. The Dangers of Being Seduced by Elliott Wave Theory Now, despite my interpretation of Elliot Wave analysis having proved highly accurate both before and since the March 2009 low and the above also very convincing on where the Dow could trend during 2011. However, before you start thinking that EWT maybe the 'holy grail' of analysis, take note that EWT Analysis on its own is just ONE component, and therefore one should not let oneself become seduced by what is highly seductive in the ease to which multiple junctures can be extended into the far distant future, which is how the highly public self professed Elliott Wave Gurus like it to be seen to be, though many of whom have apparently missed THE WHOLE STOCKS BULL MARKET as they continue to call one of the greatest bull markets in history a Bear Market rally and thus suffer from a case of permanent amnesia! which should send anyone's alarm bells ringing! Therefore Elliott Wave Theory, whilst continuing to strongly imply a bull run is expected to continue into end of 2011, however on it's own, in the long-run it is NOT going to be more accurate than a coin toss! The conclusions no matter how convincing of ANY single Component tool NEED to be confirmed by other fundamental and Technical analysis so as to arrive at a probable final conclusion rather than that which is perpetuated by EWT fanatics that have long since left reality behind them as evidenced by the fact that they still put their names to the worthless banner of a stocks "Bear Market Rally" that is anything but, under any rational measure. Therefore despite EWT being a useful tool, I am ALWAYS on guard against being seduced by EWT as it is extremely easy to back fit onto what has already happened to imply something highly probable is about to take place when the complete opposite may be true. So yes, whilst it's implications can get the adrenaline pumping and one eager to hit the TRADE button! I do have to take deep breaths and remember that there are NO short cuts! NO matter how enticing it appears, on its own EWT in the long-run WILL NOT be more accurate than COIN TOSS ! So, always keep in your mind that the EWT component Equates to a Coin Toss Over the Long-run and you won't become seduced and end up missing whole bull markets as MANY so called MASTER ELLIOTTITIONS have proceed to do ! Because they believe their own hype, much as gannophiles have been seduced by the master price time squares that is yet again another example of coin flip analysis elevated to 'holy grail' high priesthood status so as to perpetuate myths along the same lines that religious myths of so called revelations are perpetuated to fit in hindsight any subsequent event! When in reality EWT's true purpose should be to skew ones perception of the price action thus enabling an unbiased and always skeptical analysts to interpret price action from another perspective as part of a broader whole, even this will not guarantee success because analysis and trading boils down to probabilities and NOT certainties of outcome. U.S. Dollar and Stock Market Trend Relationship, Currency and Real Wars See Stocks Stealth Bull Market Ebook (FREE DOWNLOAD) Economy & Inflation Conclusions Applied to the Stock Market See Stocks Stealth Bull Market Ebook (FREE DOWNLOAD) Stock Market Mega-Inflationary Trend See Stocks Stealth Bull Market Ebook (FREE DOWNLOAD) Japanese Nuclear Meltdown Black Swan See Stocks Stealth Bull Market Ebook (FREE DOWNLOAD) Market Manipulation See Stocks Stealth Bull Market Ebook (FREE DOWNLOAD) Current Stock Market Sentiment & Psychology See Stocks Stealth Bull Market Ebook (FREE DOWNLOAD) Quantitative Easing AKA Money Printing See Stocks Stealth Bull Market Ebook (FREE DOWNLOAD) Stock Market Technical Analysis TIME ANALYSIS - The first leg of the bull market from March 2009 to April 2010 lasted 13 months which was followed by a 2.5 month correction. A similar bull run from the July 2010 low would extend into early August 2011, with subsequent correction into early October. Bear Market and the 1930's Stock Price Chart Pattern - Stock charts from virtually every year of the 1930's have been repeatedly plastered across the blogosfear during the past 2 years to imply x,y,z is imminent, only to be immediately busted by subsequent price action, just as I have been warning they would be since April 2009, as at the end of the day fitting past price charts onto the present ONLY works in hindsight and are totally worthless when it comes actually trying to determine and monetize on trends so plays no part in this analysis, and I am sure having exhausted comparisons against the 1930's charts we shall soon start to see stock index charts conjured up from across the 130 year span of the Dow Jones index.
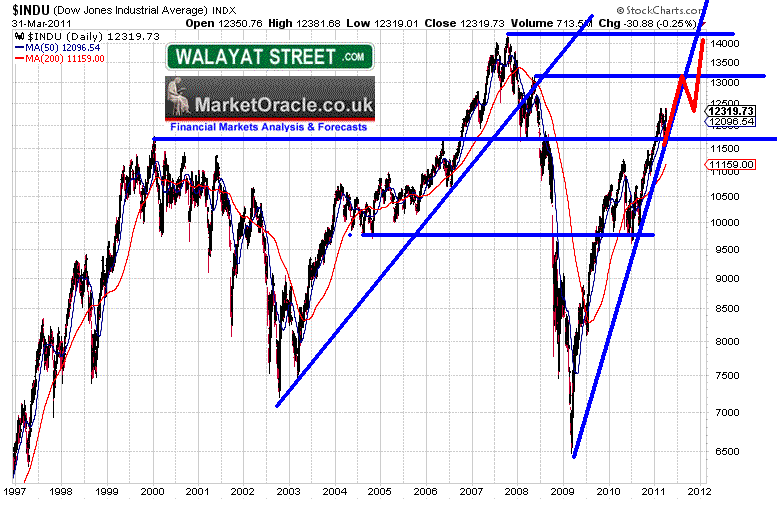
LONG-TERM TREND ANALYSIS- The long-term Dow chart shows an index on a trend trajectory towards a new all time high before the end of this year. There are two identified resistance points to overcome along this path, firstly 13,150 and then the actual all time high of 14,200. This suggests a correction off of 13,150 and 14,200 this year, this trend implies a break of the existing up trendline as occurred during 2010.
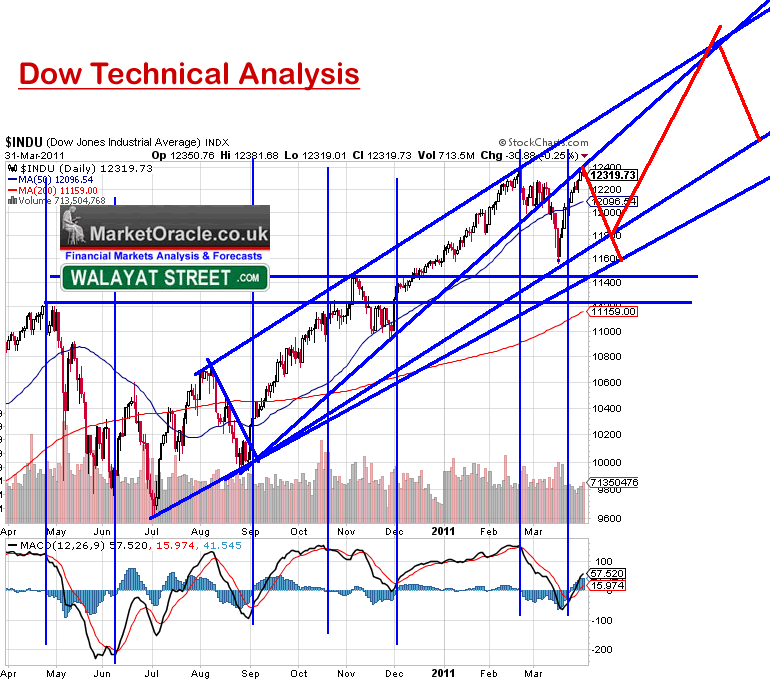
TREND ANALYSIS- The Dow is at the bull market high resistance level where trend analysis suggests a further correction is likely that could extend into late April / Early May before the breakout higher off of a technically stronger higher low before the next phase of the bull market breakout towards 13200 by Aug / Sept, followed by a further correction. WESTERN STOCK MARKETS QUICK TREND REVIEW
Overall is that of markets either breaking higher or within trading ranges ahead of a breakout higher (even for Japan), so supportive for a continuation of the global bull market in stocks. DOW GOLD - A number of analysts obsesses over the Dow / Gold Ratio as if it means anything. The bottom line is you cannot buy Dow stocks with Gold and nor can you buy Gold with Dow stocks. You might as well price Dow in pork bellies or wheat, or any other commodity for it has no relevance. For there to be a relevance markets have to be in the same sector i.e. Dow compared to global stock market valuations. INTERMARKET ANALYSIS - Stocks and Commodities continue to trend higher together which are usually competing asset classes, but falling bonds more than liberate enough capital from that market to feed both bull markets. In fact contrary to the consensus view that bonds and stocks should move in the same direction, a weak bond market gives the Fed even more impetus to pump liquidity into the financial markets. Also as mentioned earlier in the interest rate analysis, rising bond yields are indicative of an improving economy. SUPPORT / RESISTANCE- The Dow is trading at the bull market resistance area of 12,400. Key resistance levels beyond this level are 13,150 and the all time high of 14,200, which can act as two points for future corrections. Support lies along a string of early March highs and lows in the range of 12,000 and 12,250, which are likely to contain any imminent correction. MOVING AVERAGES - The Dow continues to trend well above its 200 day moving average (11,170) with the recent correction helping to narrow the gap that still requires further consolidation before trending higher. Expectations for a correction are further confirmed by the strength of the break of the 50day moving average during March which suggests several more touches or breaks of the 50day are likely which is currently at 12,100. PRICE TARGETS - Upside price targets are resolving towards 13,150 and the all time high of 14,200. Downside price targets resolve towards 12,000. MACD - Long term MACD is on a trajectory that points to the bull run continuing into 2012. Immediate MACD suggests that the current bull run has several months to run, therefore any imminent correction should be short in duration and unlikely to continue into May, a further mild correction can be expected during July / August.
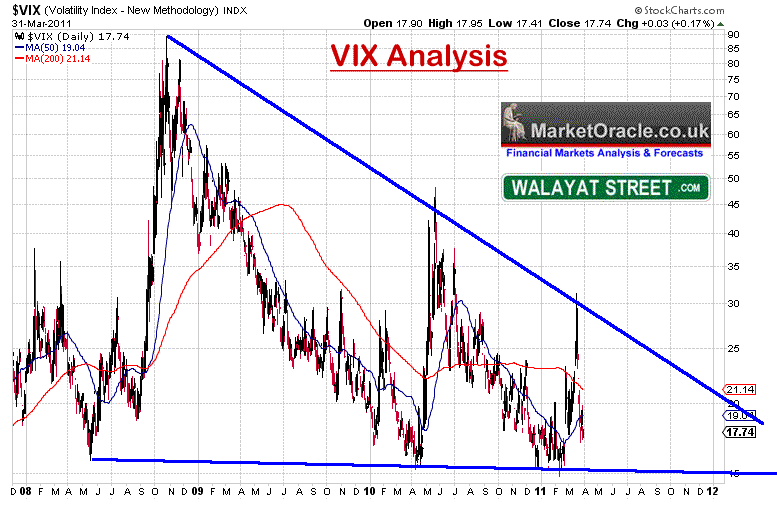
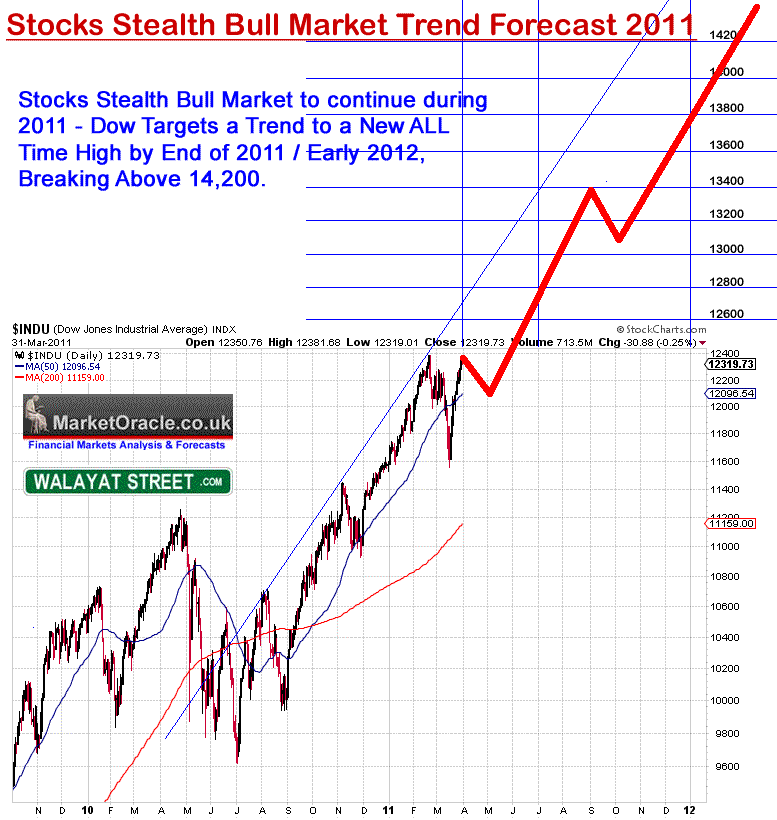
VOLATILITY (VIX)- Stock Market volatility as measured by the VIX has fallen back from a peak of 30 made earlier in the month. The overall trend trajectory is that of reducing volatility as each successive spike has reduced in intensity despite the turmoil across the world, this is suggestive of milder corrections ahead and more powerful uptrend's going forward for the next 12 months at least and probably longer as investor confidence continues to turn more bullish in the face of a relentless bullish uptrend and therefore investors become more eager to buy the dips as stocks continue to rise a wall of worry. VOLUME - Volume has continued to remain generally weak throughout the rally, which has been one of the main reasons why so much commentary has been bearish during the past 2 years. However, this is perfectly inline with that of a stocks stealth bull market as it implies that this rally has mostly NOT been bought into. Therefore, I continue to expect heavier volume on the declines and lighter volume on the rallies all the way to a new all time market high. SEASONAL TREND - The seasonal trend is for a rally into early May when the "Sell in May and Go Away" trend implies a correction into early September for a continuation higher into year end. Instead this year it may be a case of Sell April and Buy May. PRESIDENT CYCLE YEAR 3 - We are now well into the third year of Barack Obama's Presidency, statistical analysis reveals that most of the third year tends to be a great period for stocks showing an average gain of 20%, which is not so surprising as Presidents tend to start looking towards getting re-elected (or their party) and hence boost the economy. So far stocks are up approx 10% from November 2010, another 10% would put the Dow at 13,640, so confirms an overall bullish outlook for the Dow for the remainder of 2011, with a possible dip during November. Formulating a Stock Market Conclusion for 2011 The overwhelming conclusion is that of stocks remaining in a MULTI-YEAR BULL MARKET that is being driven higher by a number of fundamental factors such as corporate earnings OR Fed MONEY PRINTING (POMO). It does not matter which is prevalent at a particular point in time as the market SPIRALS HIGHER in reaction to both waves of INFLATIONARY buying pressure, something that the dark pools of capital recognised right at the birth of the Stocks Stealth Bull Market in March 2009 (15 Mar 2009 - Stealth Bull Market Follows Stocks Bear Market Bottom at Dow 6,470 ) and have since been eager to bid the stock market higher whilst MOST have FAILED to participate on the rally to date as they have been fooled into waiting for the bear market bottom to materialise (or even worse have been actively engaged in betting against the bull market) and will continue to do so all the way to new all time highs which is why this remains STOCKS STEALTH BULL MARKET. The same INFLATIONARY forces are driving up ALL assets such as commodities, whilst at the same time holding up other weaker assets such as housing that should be in free fall as the bubble baton has been passed from one asset class to another. In our fiat currency, big government deficit spending, debt accumulating world, governments CANNOT ALLOW FOR DEFLATION, not only that but inflation can literally always be created at the press of a button, therefore as asset prices are leveraged to consumer prices that is where wealth protection strategies should continue to be focused. The reason why many analysts can miss whole bull and bear markets is because they get attached to one or two elements and then run a mile with it, such as the rise of China and India and demise of the U.S. along with much of the west, or the impact of demographics as ageing populations hit the west hard, though China will be hit even harder in the 2020's, or the fact that the US is on the path towards bankruptcy (by means of high inflation), well yes it is, but so what? Because that path will contain many bull and bear markets, the consequences of a bankruptcy event are probably many decades away. So one needs to be focused on the time horizons at hand not take a view of the world say 40 years down the road when there is so much that can happen between now and then (as the Japan environmental and nuclear disaster illustrates) that can completely flip the future world view on its head. So what is going to happen or not happen 40 years from now is pretty much irrelevant in determining the stock market trend for 2011. Key points to consider are that the US economy is strengthening, the world economy is improving (despite the Japan black swan), that slowly the Eurozone is immunizing itself form the bankrupting PIIGS, and without repeating what's stated at length in the Interest Rate Mega-Trend Ebook (FREE DOWNLOAD) that despite the bankrupt banks still remaining bankrupt, but less so than where they were a year ago, and so long as they remain busted the worlds central banks fearing financial armageddon are continuing the flow of easy money so as to transfer tax payer / savers wealth onto the balance sheet of the bankrupt banks which looks set to continue for at least the remainder of 2011. Yes all this money printing primarily as an aid for the bankrupt banks to put even bigger bets on the derivatives markets that is INFLATING asset prices such as stocks and commodities. Yes all this also means ever higher real world inflation which stock prices are leveraged to, but again that was covered at length in the Inflation Mega-trend Ebook of January 2010. (FREE DOWNLOAD) The technical picture remains bullish on near every level for 2011, as much of the consensus view on the impact of the likes of rising interest rates are just flat out wrong! Rising Interest rates are BULLISH for stocks! It's what happens AFTER interest rates have risen that hits the stock market and economy, and not during the actual trend. Even the highly contrary Hindenburg Crash Omen has been doing the rounds again in the mainstream press just as the market bottomed (why does the financial press never learn?). Therefore there is nothing in this analysis to suggest that an end to the stocks stealth bull market is imminent, far from it, I see no reason why the stock market should not continue trending higher well into 2012 (yes there will be corrections for the highly vocal perma-bears to pounce upon once more to announce an end to the non existant bear market rally). So the question left to answer is to what heights will the stock market reach by the end of 2011 / early 2012, which I next attempt to conclude towards. STOCK MARKET FORECAST 2011 FINAL CONCLUSION The big picture is that of the stock market targeting a trend towards a new all time high either by very late 2011 or early 2012 i.e. a break of Dow 14,200 which would represent a gain of more than 15% on the last close (12,320) or nearly 2000 points. Breaking the forecast trend down suggests a short trading range into late April, with the main trend of a rally into late August / Early Sept 2011 in the region of 13,400, followed by a further brief correction into early October before the rally to a new all time Dow high by end 2011 / early 2012, as illustrated by the below forecast trend graph.
Risks to the Forecast That the current anticipated consolidation trading range actually turns into a market top - After all the banks are still bankrupt and continue to play double or nothing in the derivatives markets which the central banks are attempting to cover up the consequences of from main street so as to prevent public panic manifesting itself in runs on the banking system. So yes there is always a big dark cloud hanging over this stealth bull market which is why it is a stealth bull market because it is easy to find reasons of why it should have ended within a few weeks after it began! And then we have the inflation mega-trend juggernaut that has taken off in the UK and is soon to make an appearance in the US, which could derails the stocks bull market, but central bankers are practices in the dark arts of pumping out economic propaganda to manipulate the inflation expectations of the general population via the vested interests in the mainstream press who in a matter of fact way paint a picture that is totally at odds with the reality of what their viewers / readers experience. Therefore the risks are always there but on the balance of probabilities (and that is all that it boils down to i.e. probabilities), and contrary to much of what you will read in the mainstream press, I rank an end to the stocks bull market during 2011 as a VERY LOW probability, despite REAL inherent risks that are NOT new but have existed for the duration of the now 2 year stocks stealth bull market. The SHOCK MARKET BUBBLE I call it a shock market rather than a stock market because ALL market trends are trending towards a bubble that bursts in spectacular style because of the two factors involved of a. central banks trying to generate economic growth by means of the wealth effect which increasingly entices speculators to pile into the trends as the feed back look of higher prices triggers more speculative buying in an ever increasing frenzy of irrational activity that sends both stock prices and the wealth effect soaring in to the stratosphere, triggering consumers to buy junk that they don't need or will probably only ever use once. Given that we are in a stocks stealth bull market that has passed by the vast majority of investors illustrates the fact that this stock market bubble has barely begun to be built, we are several years away from the SHOCK MARKET BUBBLE stage, at which point I will be handing over my stock certificates to the last to buy before the next crash. You know when we will get there because those that are so vocally bearish today will have thrown in the towel and turned into bulls (of course re-inventing history as to what they had actually stated when stocks were cheap!). You may continuously hear that investing in the stock market is akin to gambling in the casino, that's not entirely true because where the stock market is concerned the hand you hold does not particularly matter, good or bad they are on balance the same, the only thing that matters is that you buy when the hands are cheap and sell when the hands are expensive, as at the end of the bull trend, even the best hands will be crushed nearly as badly as the worst hands. So investing in the the stock market is NOT the same as gambling in the casino as long as one does not get influenced by market sentiment and let emotions rip, there should be no sentimentality involved as we witness today with those investing in the likes of Apple.
Where are we in terms of the big picture? Considering the forecast trend path and the sum of this analysis suggests we are probably around the mid way point of this bull market in time, which therefore suggests that this bull market will significantly break above the ALL time Dow high. Now, bears should not take the above to imply that the bull market will end north of Dow 15k in about 2 years time, that will be for stock market update for 2013. Another thing to consider is that a series of bear markets and financial crashes over the past 11 years has succeeded in keeping many potential investors scared of investing in the stock market for a generation, which tells me that the market is primed for a bull run for not just this year but for several more years, because we are just so far from the herd creation stage that is associated with many final blow offs, and remember all financial crashes mark the starting points for the next stock or shock market bubble . Lastly, I give thanks to the perma-bears and Dr Dooms and other media star 'analysts' that spend more time in the tv studio make-up rooms than in front of trading screens for promoting the bearish side. For it is a zero sum game, which means those smart / lucky enough to have monetized on the stocks stealth bull market to date need suckers betting against the bull market to fund the profits for several more years and many thousand more points on the Dow. FTSE 100 Stocks Index Forecast 2011 See Stocks Stealth Bull Market Ebook (FREE DOWNLOAD) Emerging Markets Outlook 2011For India, Russia, and China - See Stocks Stealth Bull Market Ebook (FREE DOWNLOAD) The Stocks Stealth Bull Market Update 2011 Ebook will made available for download within the next few days via the free newsletter. Source and Comments: http://www.marketoracle.co.uk/Article27334.html By Nadeem Walayat Copyright © 2005-2011 Marketoracle.co.uk (Market Oracle Ltd). All rights reserved.
Disclaimer: The above is a matter of opinion provided for general information purposes only and is not intended as investment advice. Information and analysis above are derived from sources and utilising methods believed to be reliable, but we cannot accept responsibility for any trading losses you may incur as a result of this analysis. Individuals should consult with their personal financial advisors before engaging in any trading activities.
You're receiving this Email because you've registered with our website. How to Subscribe Click here to register and get our FREE Newsletter To access the Newsletter archive this link Forward a Message to Someone this link To update your preferences this link How to Unsubscribe - this link
The Market Oracle is a FREE Financial Markets Forecasting & Analysis Newsletter and online publication. | |||||||||||||