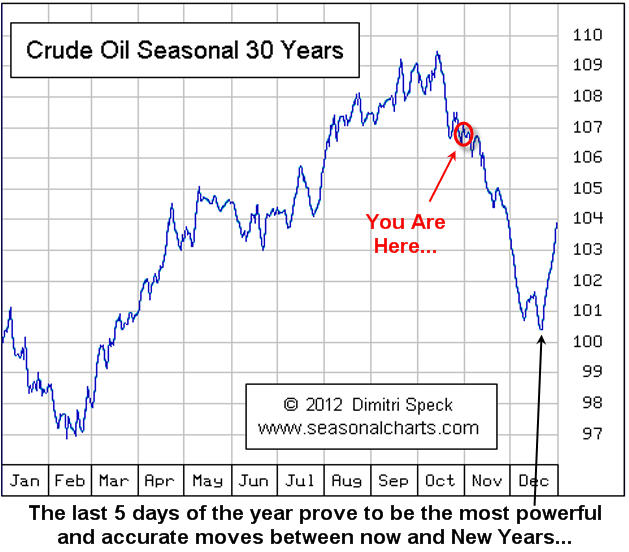
Crude Oil Price and Oil Stocks Seasonality, Trend ForecastDear Reader Chris Vermeulen writes: Crude oil has had some large price swings this year and another one may be on its way. This report shows the seasonality of crude oil along with where oil is trading and what the oil service stocks are telling us is likely to happen going into year end. Since WTI Crude Oil topped out in September at the $100 resistance level (Century Number) many traders are looking for a bounce or bottom to form in the next week. Historical charts show that on average the price of oil falls during November and the first half of December.
The charts of oil and oil stocks shown below have formed patterns on both time frames (weekly & daily) that lower prices are to be expected. If you did not read my Gold Seasonality Report I just posted be sure to review it here: Gold Seasonal Report
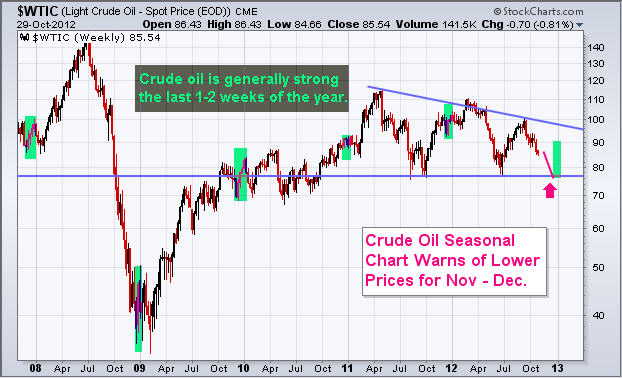
WTI Crude Oil Weekly Chart:
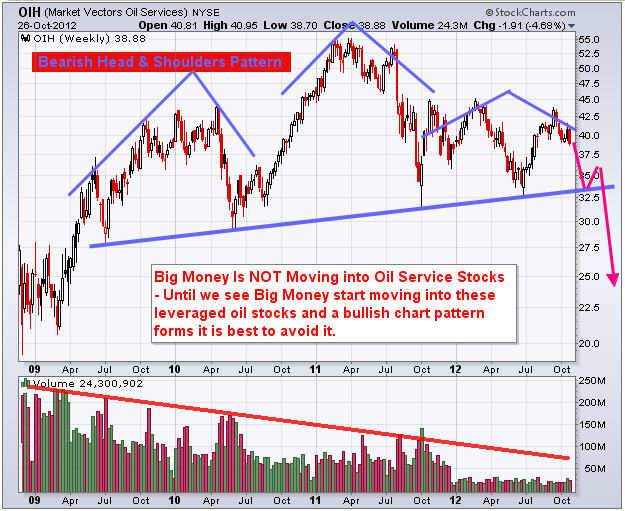
Oil Services Stocks – Weekly Chart: The weekly chart oil stocks show a very large bearish head & shoulders pattern. While I do not think the neckline will be broken it is very possible. One of the most important pieces of data on the chart is the VOLUME. Notice the lack of it… Volume tells us how much interest and power is behind chart patterns and declining volume clearly tells us these investments are out of favor currently and that big money is not moving into them.
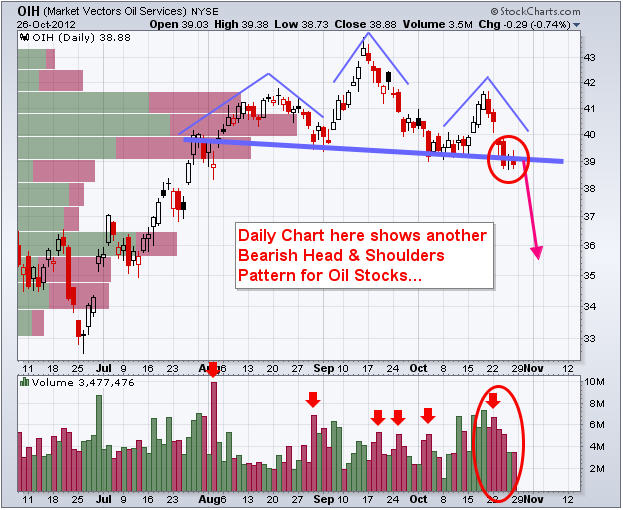
Oil Services Stocks – DAILY Chart:
WTI Crude Oil and Oil Service Stocks Trading Conclusion: If you would like to learn more about trading and get my trading alerts visit By Chris Vermeulen Please visit my website for more information. http://www.TheGoldAndOilGuy.com Chris Vermeulen is Founder of the popular trading site TheGoldAndOilGuy.com. There he shares his highly successful, low-risk trading method. For 7 years Chris has been a leader in teaching others to skillfully trade in gold, oil, and silver in both bull and bear markets. Subscribers to his service depend on Chris' uniquely consistent investment opportunities that carry exceptionally low risk and high return. This article is intended solely for information purposes. The opinions are those of the author only. Please conduct further research and consult your financial advisor before making any investment/trading decision. No responsibility can be accepted for losses that may result as a consequence of trading on the basis of this analysis.
You're receiving this Email because you've registered with our website. How to Subscribe Click here to register and get our FREE Newsletter To access the Newsletter archive this link Forward a Message to Someone this link To update your preferences this link How to Unsubscribe - this link
The Market Oracle is a FREE Financial Markets Forecasting & Analysis Newsletter and online publication. | |||||||||||||

Wednesday 31 October 2012
Crude Oil Price and Oil Stocks Seasonality, Trend Forecast

Sunday 28 October 2012
Who Will Win the U.S. Presidential Election, Forecast 2012
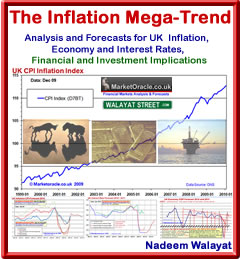
Who Will Win the U.S. Presidential Election, Forecast 2012Stocks Stealth Bull Market 2011 Ebook Direct Download Link (PDF 2.8m/b) Interest Rate Mega-Trend Ebook Direct Download Link (PDF 2.3m/b) Inflation Mega-Trend Ebook Direct Download Link (PDF 3.2m/b) Dear Reader The final countdown to the U.S. presidential election has now begun with expectations that there is little that each candidate can now effect on the electorate during the remaining 10 days. Most opinion polls currently put Romney slightly ahead of Obama i.e. ABC 50/47, BBC Poll of Polls 49/47, Gallop 48/48. However the high margin of error of as much as +/-5%, and typically +/-3% compounded by the electoral college system makes all of these opinion polls unreliable in trying to determine the US election outcome, therefore this analysis is focused on key events that impact on determining a probable forecast for the US presidential election 2012.
The time-line of key events begins with Romney's infamous own goal 47% video that resulted in a near collapse of Romney's poll ratings which set the scene for a virtual walk in the park re-election for President Obama who had always been the favourite, as long as he did not make the mistake of taking the voters for granted.
"There are 47 percent of the people who will vote for the president no matter what. All right, there are 47 percent who are with him, who are dependent upon government, who believe that they are victims, who believe the government has a responsibility to care for them, who believe that they are entitled to health care, to food, to housing, to you name it. That, that's an entitlement. And the government should give it to them. And they will vote for this president no matter what." 3rd October - Romney Wins the First Presidential Debate President Obama turned out to be his worst enemy by following what was clearly disastrous advice and handing Romney a decisive win and an actual chance at the White House as polls started to narrow.
6th October - US Employment Rescue, Obama reelection virtually guaranteed If there is one issue that ranks highest amongst most of the electorate than that would be Jobs. Therefore Obama averted possible election disaster by the BLS publishing a highly favourable employment report for September that showed the US unemployment rate falling below 8% to 7.8% for the first time in some 45 months, against which Romney was left to make statements that did not stand up to scrutiny as the below unemployment record graph shows that there was little Romney could say that could counter Obama's Jobs performance that followed the Bush economic disaster.
The unemployment data halted the momentum that had been building following the first debate. This led me to conclude at the time that rather than the race being as tight as the mainstream pundits were suggesting as they mistakenly were extrapolating the Romney momentum all the way into election day, and despite two debates pending, President Obama was still heading for a relatively strong re-election victory of over 300 electoral votes (270 needed to win) as I correctly concluded the Romney momentum had ended, and that it had never actually seen Romney take an actual lead over Obama at any point. 06 Oct 2012 - High U.S. Unemployment Rate, Obama Failure or Bush Catastrophe for Romney to Continue? Therefore many american's may be surprised on election night when the results start coming in that point to a relatively strong Obama election win of more than 300 Electoral votes. Can October Jobs Report Help Romney? The October Jobs report is due just 4 days before the election (November 2nd), if it is very bad then yes it could help Romney, just as a good jobs report helped Obama. But the election momentum continues in Obama's as is the overall down-trend in the official unemployment data. However as my analysis of 6th October stated, the trend in US unemployment is likely to rise into mid 2013, this is due to the level of corruptness in reported employment statistics against real US unemployment (U6) that the below graph illustrates -
An analysis of the rate of corruption suggests that a. the Bush regime during the last 3 years of it's Presidency was engaged in maximising the level of corruption in the official unemployment statistics. b. That the Obama regime official statistics have in the lead up to the 2012 Election increasingly become more corrupt with the final statistics on par with that of the Bush regimes efforts in the lead up to the November 2008 election. Therefore whilst the real rate of unemployment is reducing as both graphs exhibit a downtrend, the actual extent of the fall in unemployment is far less than the official statistics suggests, which luckily for Obama is that which most of the general population focuses upon. Therefore probability favours a rise in the U.S. unemployment rate as will be reported on the Friday ahead of the Tuesday election. The big question mark is to what extent could that figure rise, Obama is hoping for a marginal rise to 7.9%, and Romney for a rate at above 8%, my expectation is for a marginal rise to 7.9% under the basis that the U.S. economy continues to bounce into election as evidenced by latest GDP data of 2% per annum. 16nd October - Aggressive Obama Wins 2nd Presidential debate. Obama sought to avert a reply of the disaster of the first debate and in so doing put the poll trajectory back in his favour as the gap between Romney and Obama once more starts to widen.
22nd October - Third Presidential Election Debate - Romney's Failure. Most viewers and commentators would give Obama a slight edge over Romney in the third and final debate, his last chance to build momentum, instead Romney tried hard to appear a man of peace after having made a string of statements in the past that alluded to an aggressive foreign policy and Obama focused on domestic reasons for why he should be re-elected. In fact the whole debate stands out for the continuous statements of agreement on subject after subject which ultimately favoured Obama and hence fed the trend for a widening in the gap between Obama and Romney. Therefore Romney blew his last chance towards building momentum so the strategy for agreeing with Obama was a mistake.
The bottom line is that Romney failed to re-ignite the momentum that built up following he first debate that was halted by the 6th October Unemployment report, instead his performance during subsequent debates has been weaker than Obama's and therefore the election really was lost by Mitt Romney during mid September following the 47% video, which crippled his chance of ever taking the lead as I correctly suggested at the time (19 Sep 2012 - The Day Mitt Romney Lost the U.S. Presidential Election 2012, Youtube Fund Raising Video). Source: http://www.marketoracle.co.uk/Article37226.html By Nadeem Walayat Copyright © 2005-2012 Marketoracle.co.uk (Market Oracle Ltd). All rights reserved. Nadeem Walayat has over 25 years experience of trading derivatives, portfolio management and analysing the financial markets, including one of few who both anticipated and Beat the 1987 Crash. Nadeem's forward looking analysis focuses on UK inflation, economy, interest rates and housing market. He is the author of three ebook's - The Inflation Mega-Trend; The Interest Rate Mega-Trend and The Stocks Stealth Bull Market Update 2011 that can be downloaded for Free.
Nadeem is the Editor of The Market Oracle, a FREE Daily Financial Markets Analysis & Forecasting online publication that presents in-depth analysis from over 600 experienced analysts on a range of views of the probable direction of the financial markets, thus enabling our readers to arrive at an informed opinion on future market direction. http://www.marketoracle.co.uk Disclaimer: The above is a matter of opinion provided for general information purposes only and is not intended as investment advice. Information and analysis above are derived from sources and utilising methods believed to be reliable, but we cannot accept responsibility for any trading losses you may incur as a result of this analysis. Individuals should consult with their personal financial advisors before engaging in any trading activities.
You're receiving this Email because you've registered with our website. How to Subscribe Click here to register and get our FREE Newsletter To access the Newsletter archive this link Forward a Message to Someone this link To update your preferences this link How to Unsubscribe - this link
The Market Oracle is a FREE Financial Markets Forecasting & Analysis Newsletter and online publication. | ||||||||||||||

Sunday 21 October 2012
Stock Market Crash Investing Lessons and the Real Secrets of Successful Trading
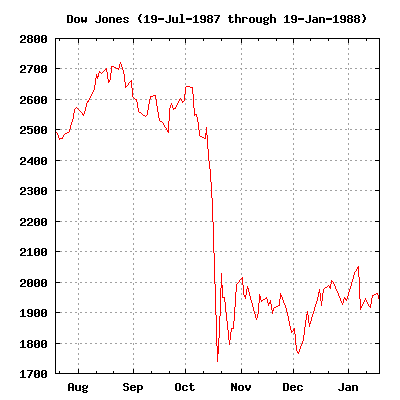
Stock Market Crash Investing Lessons and the Real Secrets of Successful TradingStocks Stealth Bull Market 2011 Ebook Direct Download Link (PDF 2.8m/b) Interest Rate Mega-Trend Ebook Direct Download Link (PDF 2.3m/b) Inflation Mega-Trend Ebook Direct Download Link (PDF 3.2m/b) Dear Reader On Friday the stock market (Dow) plunged by 205 points, or 1.5%, that was explained by the mainstream financial press after the fact in terms of market response to corporate earnings news events, but having all but forgotten that Friday the 19th was the 25th anniversary of the Great Stock Market Crash of 1987 which saw the Dow crash by 508 points, 22% in a single days trading that still echo's through time just as the 1929 Great Crash (10% drop) echo's to make their presence felt each October that acts to reinforce the seasonal tendency for Octobers to be a negative month for stocks. Stock Market Crash, Collapse, Armageddon Lessons for Investors The Great Crash of 1987 destroyed investor confidence that had been built up to fever pitch during the preceding 5 year long bull market. Investors were at that point ripe to be suckered into expectations for a replay of the 1930's Great Depression and stock market collapse scenario that is always bubbling away, waiting to strike AFTER each crash, to claim that financial armageddon has finally arrived. Unfortunately for terrified investors who mistakenly fell for the doom mantra would have not only missed out on the greatest bull market in history but possibly seen their wealth disappear during the subsequent 12 years as they bet against it, only to finally to realise too late that the perma bear mantra was wrong as they eventually succumbed to the euphoria of the final stages of the dot com bubble, but then to once more be wiped out on the subsequent crash that the doom merchants would claim to have forewarned off when the truth is that the doom mantra would have bankrupted all many times over during the preceding decade. What is the Lesson of not just 1987 Crash but ALL Crashes and Bear markets? The facts are if you had BOUGHT on the day following the crash of 1987 you would have made a return of 666% by now (13343 / 1740) or 26% per year BEFORE dividends, which is set against an average Inflation rate of 3%, and same holds true for if you had invested at any point following the 1929 crash!
Today's Dow 13,343. What is 13,343 divided by 381 ? What are the trend trajectories off either the 1929 bull market high or the 1932, 1987 low ? And the same holds true for most western developed general stock market indices. Now before you play pick and mix with indices, know that my analysis is focused primarily on the Dow and FTSE where the trend for these can be extrapolated to other general stock indices such as the S&P 500 and not sectors which new technologies can make redundant. Knowing these facts gives one a head start on most investors that let themselves get caught up by the media hype and sales pitches of perma doom merchants. Contrary to the vague utterances of media whores, whose commentary with the benefit of hindsight can be interpreted towards any outcome, the reality is that significant investments can only be entered into on under the basis of firm conviction's of rewards far out weighing the potential risks, i.e. to invest when stocks are cheap where the risk is that stocks could get cheaper - March 2009 - Stealth Bull Market Follows Stocks Bear Market Bottom at Dow 6,470). Subsequent price action spanning many months and even years does effect risk vs reward which is what investors should be focused upon, and not the media whores or perma-fools of whatever persuasion. Trading the Great Crash of 1987 In 1987 the stock futures markets were in the infancy, where markets such as that for the Dow Jones index not formerly in existence. The only way a small time trader such as myself could gain exposure to such markets was via the likes of IG Index, spread book maker, which offered the facility of trading the futures markets at an affordable level of risk. The key elements were - a. Small position sizes of as little as £2 per point, b. all of the commission was included in the spread between the buying and selling price and c. IG offered guaranteed stop losses, so that the risk was absolutely controlled, at a little extra cost included in the spread. Stop losses are a critical element of successful trading, as you have to know when you are wrong and the best way is for the market to tell you that you are wrong by stopping you out of your position. Pre- 1987 Crash - The Great Storm Hits Southern England ! Thursday 15th October - Michael Fish is a Weather Man
My analysis had expected an up day and therefore the initial position was for the Dow to rally, this was stopped out with a loss of £165. Later in the session I took a chart trigger to go long again which I closed out with a profit of £100, so I ended the day with a small loss of £65. However the earlier downtrend had weakened the Dow and risked a break below the Sept 07 low. With the winds buffeting the house, some 180 miles north of central london, I eventually decided that tomorrow would be a strong down day for the FTSE given the brewing storm, both weather and financial. Friday 16th October - The Hurricane Hit Southern England
I called IG index up, half expecting no one to pick up and was pleasantly surprised that they were open for business ! Whilst I waited for the Dow Jones to make up its mind on whether it wants to break the Sept low, I shorted the FTSE twice during the day with the expectation that the unexpected storm would drive stock markets lower, and exited prior to the close with two profit trades of £305 and £30. I was alarmed by the sell off in the Dow which closed Friday sharply lower, not only decidedly breaking the September low, but the downtrend appeared to be accelerating. I spent the whole of Friday and Saturday contemplating the change in market behaviour and it slowly dawned on me by Sunday that the market was going to crash ! Being isolated from market commentators, I was not aware of the reasons of why it should crash rather that the Market's character had changed. I was kicking myself for closing the two short FTSE positions by Fridays close! For I concluded that if it was now obvious to me, a newbie to trading that the stock market was going to crash on Monday then it must be obvious to everyone else in the world ! I.e. the experienced futures and stock traders ? Therefore the futures would discount the crash and therefore how can I make any money by shorting the market on Monday's open? Anyway after resigning myself to more or less having missed the boat, I had decided that I would see if its worth shorting the market on the open, hopefully the futures will not be discounting too much of a drop, may be a hundred points from the spot indices would still enable me to profit from the anticipated stock market crash. Monday October 19th, 1987 - Stock Market Crash - Pay Day !Tell me Why I Like Black Mondays I saw the FTSE open sharply lower, down about 100 points, I sighed and called IG Index and asked for the futures prices, expecting bad news that the futures would be discounting drops of several hundred points for both the FTSE and Dow, but they were NOT ! They were discounting barely a 50 point drop from the spot indices which meant that the market was NOT expecting a stock market crash! I immediately sold the Dow Short at 2247 and the FTSE Short at 2147. Mid-day (UK Time)- I called the broker and moved the stop losses to lock in profits, which with IG Index means freeing the money for use in further positions. The FTSE was down over 200 points by now with little difference between spot and futures prices so I shorted the FTSE some more at a price of 2047.
"Hi could you give me a price for November Dow Please ?" "Yes Sir, It is trading at 2045" "Good, I would like to sell to open £5 at 2045, with a 50 point stop" " You want to sell ?" "Yes Sell", maybe he thought I was already too heavily short ? Perhaps people were to scared to short the Dow ? I don't know, but the impression I got was of surprise.on the other end of a line. So that was my fourth short opened for the day at 2045, meanwhile the actual Dow Jones spot indication was down only 50 points at about 2,200 due to slow opening of individual stocks against the actual futures nearly 150 points lower ! 7.40pm - The Dow is now down about 300 points,having rallied from about 340 down about 10 minutes earlier. Having watched the market for the last 5 hours, I get the feel that its gearing up for another bout of selling towards being 400 down, so wanting to sell more I give IG Index a call. "Hi, can you give me a price for November Dow please". "Mr Walayat, we are only accepting orders to CLOSE " Damn !!! On a £10 per point I could have made another grand on the target of 400 down by the close. 8pm - The Dow is hovering around 300 points down with an hour to go, this is nail biting time! - I can't stand this as I cannot sell short any more and and I do not want to liquidate, so I go out out for a drive and return when the US markets have closed at 9pm.
Wow ! I am rich ! rich, RICH - How much ? £14,000 at least ! From an account balance of £700 to £14000 in one day ! Okay in today's money £14,000 is not a lot to shout about, but to a 19 year old in 1987, £14,000 was an enormous amount of money especially as it was made in one day ! As an example I could have bought a terraced house in the street for about £14,000! Now what to do next ? No time or inclination for sleep, I need to work out what to do tomorrow as clearly the FTSE is going to open sharply lower! This looks like a complete and utter collapse of the financial system - 508 points down ! Not in my wildest imagination could I see the Dow Jones closing down 508 points, this crash is bigger than that of 1929! Which was about 10%, not 22% in one day! I decide to close the positions tomorrow during the morning, I have made the paper profits and now to lock them in.
The FTSE opens sharply lower and trades down by over 200 points by mid-day. Having watched the market trend lower, and having withheld on my decision to liquidate any of the positions thus far, I am absolutely exhausted by now due to not having slept in over 24 hours and actually starting to get dizzy so I give the broker a call to get some prices with the aim of liquidating all of the positions whilst I am still mentally able to do so without starting to hallucinate figment price action! IG is giving me a quote of 1720 for the FTSE and 1570 for the Dow 30. These are excellent prices, so I decide to close the larger Dow position at 1570. And move the stops on the other three positions. I set the FTSE position stops at 1790 and 1800, and the remaining Dow short position stop at 1730, i.e. just below last nights close, and 160 points above the current futures price. Wall Street Opens Sharply Higher and I am stopped out of all positions. Exhausted, I was off to bed. The OutcomeIn financial terms, I made a profit of about £12,300 virtually overnight. In EGO terms the increase was much larger!, I was off floating into fantasy land of becoming a millionaire by the time I hit 20 ! Following the stock market crash speculation was rife that some of the financial institutions may go bust , worried that my new found wealth my evaporate I withdrew more than 50% of the funds on account on the 23rd of October 1987. An Historic Marker is SET
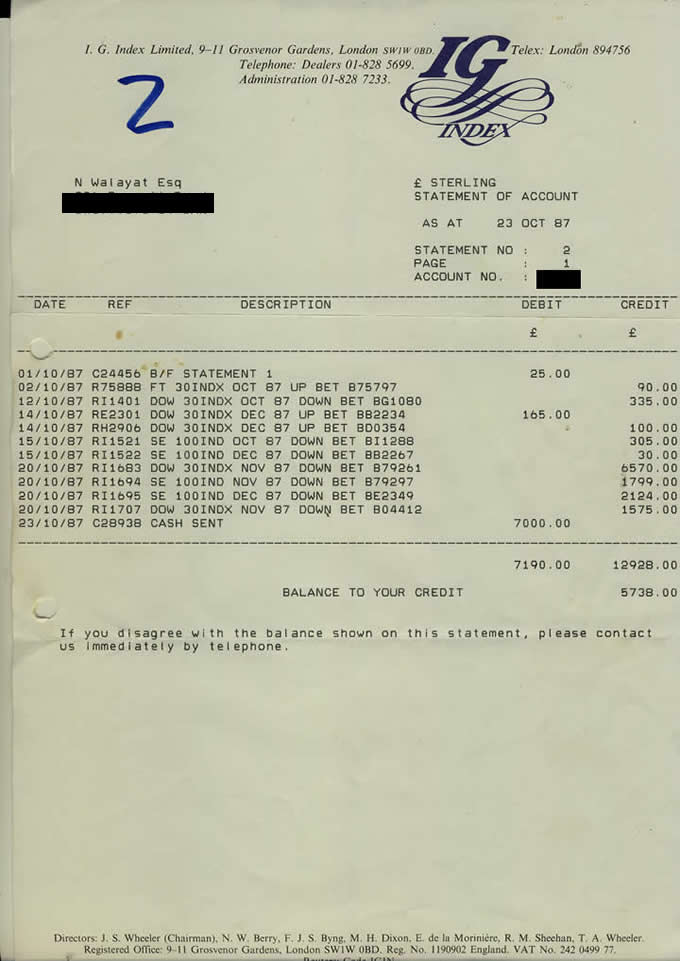
Proof Okay so you have read my account of trading the 1987 Crash and are now probably wondering, how about some proof? Well in that regard see the scan of the 1987 contract statement from IG Index -http://www.marketoracle.co.uk/images/IG_Index_October_87_statement.jpg Why 90% of Traders Lose The failure rate for financial market and commodity traders has remained at a consistently high 90% for many decades, this despite all of the advances in information technology and the flood of new learning materials that is churned out annually, therefore why is it that 90% of traders still lose ? In my opinion, a high 90% of traders are destined to lose because they are in fact learning from / listening to the 90% of losing traders that preceded them, who following wipe out in the markets have gone on to focus on writing about market price action and methodology with an even greater concentration observed to occur in the mainstream press as account busted traders / investors turn failure to trade into full time media careers and thus perpetuate a continuous cycle of failing traders guiding new traders towards similar failure. This explains why those in the mainstream financial press can literally miss WHOLE Bull and Bear markets despite trends that end up spanning many, many years. They can be recognised by their rhetoric such as the perpetual the end of the trend is coming mantra that is based on fundamentally flawed understanding of what actually moves markets, which is why they failed to succeed in trading in the first place. Given that 90% of trader fail, it can be assumed that that at least 90% of those that provide financial commentary are failed traders that spend their time writing about the act of trading rather than ever engaging in actual trading which culminates in the big name media whores that we see prancing around between make up rooms and TV Studio's, usually regurgitating what other failed traders have already commentated upon or make such weak statements that can be easily applied to virtually any outcome i.e. that the market will definitely fall, but then again it may definitely rise. The media whores are well practiced in applying such phraseology that ensures that they can always claim victory for publicity purposes whatever the actual outcome is, as the viewers are left to perceive whatever they want to in the media whore sales men's commentary, based on their own pre-existing market bias. The mainstream financial media is more than eager to push the selectively edited past commentary that results in nothing more than blatant misleading advertisements masquerading as financial market commentary. Stop for a moment and dissect what the latest utterance of a media whore actually is and you will soon realise the game of deception that is being played in an attempt to hook you in towards ultimately purchasing a product or service. In actual fact perhaps as little as 1% of the material floating out there is produced by successful traders because successful traders are primarily going to be focused on trading rather than writing about trading or marketing trading services, with probably only enough spare time to write a couple of books over their whole lifetime which compares against the book factories that can churn out as many as several titles per year that virtually ensures that at least 95% of your trading book shelf is packed full of garbage, totally useless, and you know it! Still it could be worse, academic economists inhabit a zone that is based purely on mumbo jumbo that is guaranteed to result in unforeseen outcomes, for academic economists tend to be the second greatest media whores just a step down from politicians, who exist purely to give off the air of authority and certainty as though economics is a science when in reality it is pseudo science more akin to the art of psychologically managing the general populations expectations aka economic propaganda than in determining any sense of economic reality. Economic theories are just that theories that have been modeled on selective editing of past economic data for political purposes which every trader should know (failing or successful) is just over optimised back fitting onto selective past trends that proves totally worthless going forward.
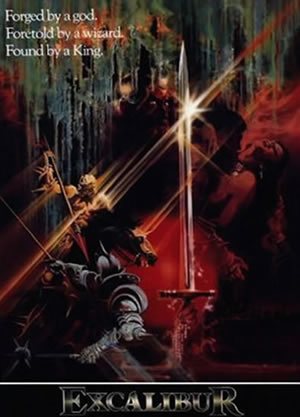
For at least the past 5 years I have wanted to write a book on the real secrets of successful trading but have never found the time to get around to doing so. However I have alluded to where the secret lies many times, in articles and more specifically in comments. The most notable of which is suggesting those wanting to learn the real secret of successful trading should watch the early 1980's film Excalibur, for the seed for their own light bulb moment. The Excalibur movie is the 1980's replay of the King Arthur myth focused on the hunt for the holy grail, (I think I first watched this movie in 1983). That should perk your interest because most traders very early on in their trading careers are convinced and easily seduced by the search for the holy grail of trading, even more so today where the internet is full of a multitude of competing holy grails out to hook traders into handing over huge sums of money for the privileged for learning. However, I have had several advantages over today's traders in my early years such as there was no internet, no smart phones, and the local library shelves bare of trading books so there was nothing to pollute my understanding of markets and trading unlike the case today where traders of all abilities can easily find themselves drowning in an ocean of various holy churches of Technical Analysis of tools, methodologies and theories. Neither was I immersed in a reinforcing trading culture as many today find themselves at the heart of the worlds major financial market trading cities such as London, New York and Chicago. Instead, I found myself trading in the back waters of far distant from the centres of the financial world, a blank canvas with no access to the consensus view of how one should trade or interpret markets. The movie Excalibur planted the seed that germinated into an important element involved in the development of my trading methodology that ultimately was able to even beat the Great Crash of 1987 that claimed many traders in its midst's. Not because I was somehow special but because I literally traded in a bubble that was filled with the likes of Excalibur and Chaos Theory, and NOT TA, and as long as I remained in that isolated bubble I was immune to the effects of the holy Churches of TA whose missionaries are always eager to seek convertion of others for a fee on promises of untold riches, that in my opinion amounts to nothing more than a sales industry geared towards selling what does not actually work as I illustrated earlier. Excalibur Light Bulb Moment - The Real Secret of Successful Trading What is the message from the arthurian myth, what is the message of Excalibur? Grail Figure: What is the secret of the Grail? Who does it serve? Do you understand ? Maybe you need to watch the movie to understand that YOU are the Grail!
I am tempted to diverge here and extend the scope of this light bulb moment far beyond the realms of trading, but you are probably not ready for that so will stick to trading. Now you understand what 90% of traders fail to understand during a lifetime of trading, as they remain on a constant hunt for the holy grail of trading where it seems to be a search for ever more complexity as being the answer, when instead the exact opposite is true, as Perceval discovered during his quest, the answer exists within you and not anywhere else! If you want to succeed in trading then pick the simplest tools such as basic trend analysis, use hand drawn charts and practice its application in a real-time trading environment and not only will you start to make money but it will literally become easier over time as you become expert in its application, as you reinforce your brain with the successful patterns of behaviour in interpreting the market price action. All with the added bonus that you need not worry yourself about latest great theory or technical tool that is about to be published. Pick one market and monitor / trade that market only. Use hand drawn charts to get close to the price, draw open high,low,close graphs for the daily, weekly and monthly charts and you will learn more about the markets you are trading then from any book or trading course. The Real Secrets of Successful Trading 1. That you don't need to know ANY Technical Analysis to Trade 2. That you don't need to read ANY Trading Book to Learn to Trade. Do not invest yourself in Trading theory, for KNOWLEDGE is not the goal of trading! It does not matter if you ever heard of Gann or Elliott that will only seek to confuse and corrupt how you think and act. The only thing that matters is that you are able to grow your trading account! 3. To focus on trading Only ONE market. 4. To learn to imprint the price action into your mind through concentrated practice, anything that gets in the way of this process will NOT help you trade i.e. the hundreds of technical indicators because you are supposed to be trading the PRICE, and NOT the indicator! So when the indicator says one thing and the Price says something different then you will be CONFUSED, so forget ALL trading indicators and focus on just the Price. 5. The Holy Grail of Trading is YOU. Not any theory or tool or trading service - But How YOU REACT to Price Movements in REAL TIME. 6. Money Management is a Critical Real Secret to Successful Trading - Using Stops, Limits and Moving them in your FAVOUR as prices move in real-time. Your sole objective is to bank profits and let losses be stopped out short. If you have any doubts about a trade then you EXIT. It is not rocket science it is trading with determination of Gain vs Loss, Plus vs Minus, nothing more! Market Forecasts At about this point you are probably asking what about the forecasts? Forecasting plays little role in trading, a shocker perhaps? But the reality is that one needs to concentrate on the current price and react to it, therefore one needs to stop second guessing the market by telling it what it should be doing which is what a forecast effectively is. However, it is not as black and white to say that one does not forecast when when reacts to price movements in real time. For every trade entered into is on the basis of a positive outcome i.e. you are forecasting that your trade will generate a potential profit (limit) against a potential risk (stop). So in reality ALL trades are entered into on the basis of a forecast, its just that the forecast is not on the basis of analysis as positions have room to breath as stops and limits are adjusted or positions liquidated on the basis of doubt in response to subsequent price action. Chaos and Forecasting
I first came across the chaos theory in the early 1980's and was eager to replicate the remarkably simple code required to generate such complex and beautiful patterns such as the Julia and Mandelbrot sets. This obsession and fascination has stayed with me since, and existed long before I became aware of the financial markets. It is probably the primary reason why I trade the way I do more than anything else, as in the early years all I understood was how to react to markets as per what chaos theory had imprinted within me, I could not imagine forecasting the markets until becoming fully aware of technical analysis. Specifically elliott wave theory and Gann Analysis both of which exhibited characteristics that were found within chaos theory i.e. fractals, but are as far as I am concerned red herrings, as the Excalibur light bulb moment illustrates and chaos theory reinforces of what elliott wave theory and gann and all other technical analysis are in terms of the holy grail of market analysis and forecasting. Today Chaos theory goes by many names, such as the 'Black Swan Events', which was coined by Nasem Taleb in his book, which I have yet to get around to reading!, but from what I have garnered it is a copy of aspects of chaos theory. Which fulfills this ages role in a more perhaps subdued manner that does not take the leap fully towards becoming a reactive mind and hence is more palatable to the technical analysis communities. The greatest example of chaos theory at work is the butterfly effect, which I am sure you have all heard of so I won't repeat. But what it implies is that order only appears to exist even in the mega-trends such as the planetary cycles that have existed for billions of years, however in reality even that cycle could be knocked out by a minor event that took place far earlier than when the system actually breaks part. Where the markets are concerned there is no effective predictable strategy, and those theories such as elliott wave theory if used as a predictive tool are highly dangerous. Yes any tool even what is perceived as a predictive tool can be used as a reactive tool. The solution here if not overly complex is to literally have multiple counts that basically suggest any number of possible outcomes. where the tendency is to lean towards the solution that most closely resembles price movements in real time, i.e. basically reacting to price movements in a highly complex and unnecessary manner. We have witnessed chaos theory in work in the ongoing banking crisis which has effectively tipped the worlds system into a new era which means that the rules of what worked during the credit boom no longer apply. Our butterfly effect was clearly when the markets were liberated from regulation in the UK this probably dates back to the 1986 big bang, so the instability in the systems have been allowed to grow unnoticed until they reached a tipping point when literally the banking system fell over the edge of a cliff. The goal of forecasts is to - a. Identify and run with the trends for as long as they persist. b. To identify the tipping points that literally change everything regardless of the fundamentals for the butterfly effect insures that the actual instability had entered the system long before the system fails to react to 'fundamentals'. It is this that enables me to realise turning points despite the weight of fundamental and technical evidence suggesting the opposite to be true at that time i.e. today's UK and US housing bull markets as of early this year that I have yet to write up because there is scant evidence in data that they actually exist, hence embryonic bull markets. Why then Forecast if it's of little use in Trading ? Whilst forecasting may not play a conscious role in trading, however that is not so for investing, where investments have their basis on accumulating into mega-trend scenarios such as the Inflation Mega-trend, Peak Oil, Demographics, Food crisis etc. Analysis and forecast acts as a road maps against which to gauge an unfolding scenarios strength or weakness so as to know whether to distribute or accumulate into when for instance when a bull market is overbought or oversold. This is something that I have highlighted countless times to readers of my forecasts but I don't think people generally take notice of what am I saying in this respect that the forecast is not as important as what the market does relative to the forecast, as this gives an ongoing indicator of market strength or weakness against a snapshot of preceding perception of what the market should do. If you are having trouble grasping the concept of reacting to price movements then I suggest get a few books on chaos theory, and perhaps also get some freely available chaos programs that draw the mandelbrot and julia sets, and then you will start to realise the way systems actually behave and thus change the way you perceive markets. My intention remains to write a book on the real secrets of successful trading and in their application, but I cannot promise when that will be. Your Disciplined and Determined REACTIVE Trading in Real Time Analyst. Source and Comments: http://www.marketoracle.co.uk/Article37116.html By Nadeem Walayat Copyright © 2005-2012 Marketoracle.co.uk (Market Oracle Ltd). All rights reserved. Nadeem Walayat has over 25 years experience of trading derivatives, portfolio management and analysing the financial markets, including one of few who both anticipated and Beat the 1987 Crash. Nadeem's forward looking analysis focuses on UK inflation, economy, interest rates and housing market. He is the author of three ebook's - The Inflation Mega-Trend; The Interest Rate Mega-Trend and The Stocks Stealth Bull Market Update 2011 that can be downloaded for Free.
Nadeem is the Editor of The Market Oracle, a FREE Daily Financial Markets Analysis & Forecasting online publication that presents in-depth analysis from over 600 experienced analysts on a range of views of the probable direction of the financial markets, thus enabling our readers to arrive at an informed opinion on future market direction. http://www.marketoracle.co.uk Disclaimer: The above is a matter of opinion provided for general information purposes only and is not intended as investment advice. Information and analysis above are derived from sources and utilising methods believed to be reliable, but we cannot accept responsibility for any trading losses you may incur as a result of this analysis. Individuals should consult with their personal financial advisors before engaging in any trading activities.
You're receiving this Email because you've registered with our website. How to Subscribe Click here to register and get our FREE Newsletter To access the Newsletter archive this link Forward a Message to Someone this link To update your preferences this link How to Unsubscribe - this link
The Market Oracle is a FREE Financial Markets Forecasting & Analysis Newsletter and online publication. | ||||||||||||||
 I remember watching Michael Fish the BBC weatherman late Thursday night, he said. "Earlier on today, apparently, a woman rang the BBC and said she heard there was a hurricane on the way; well, if you're watching, don't worry, there isn't." Well that statement has haunted the Mr Fish ever since and is a good lasting memory imprint from 1987.
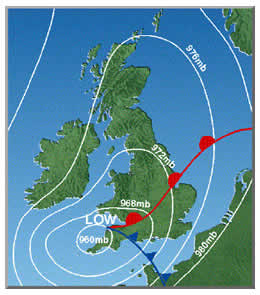 The News reporting was full of the devastation in the South of England with power cuts in many areas. Also much of the city failed to report to work and hence the UK financial markets were not fully operational.
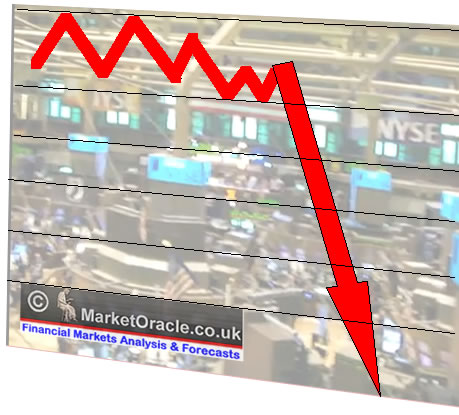 2.40pm - Wall Street opens - Well tries to open but the stocks are not opening due to the volume of selling therefore for a while the Dow Jones index is giving a false price of only having fallen a few points, the lull before the storm ? I give IG a ring to find what prices they are offering with a view to shorting some more.:
 9pm - BBC 9'0 Clock News - Dow Jones closes down 508 points at 1739 !!! cough, cough splutter, 508 ,
 Tuesday 20th October 1987 - Big Bounce Day
 The Real Secrets of Successful Trading
 What you have just read goes against the grain of a whole industry built around the forecasting of the financial markets, both in terms of trading and investing as well as publishing. Anyone who has put some serious time into studying chaos theory will soon realise that forecasting is not possible to the extent where there will be enough consistency for long-term profits.
Sunday 7 October 2012
The Solar Silver Thrust, Soaring Demand From PV Panels
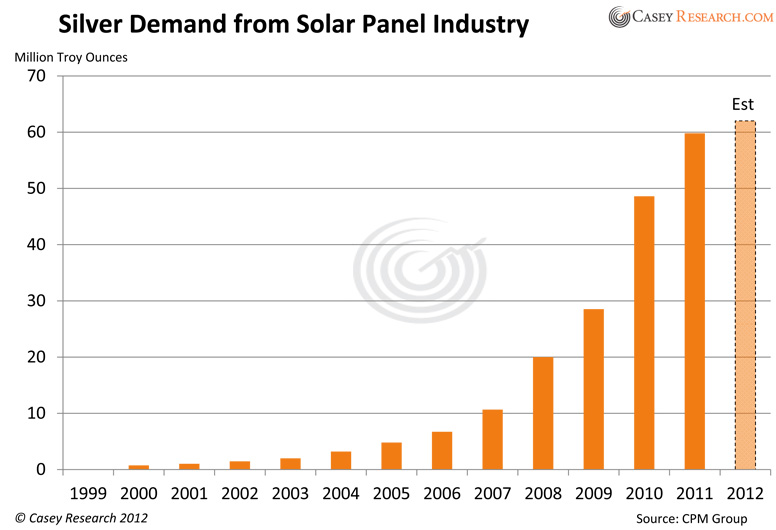
The Solar Silver Thrust, Soaring Demand From PV PanelsBy Jeff Clark, BIG GOLD : In early July, Japan set a premium price for solar energy that was three times the rate of conventional power. This meant utility companies would be paid three times more for electricity sourced from solar. It's widely expected that the premium will ignite the use of solar power – and solar uses a lot of silver. Silver Demand from PV PanelsAs you may know, silver is used in photovoltaic (PV) technology to generate solar power. A typical solar panel uses a fair amount of the metal – roughly two-thirds of an ounce (20 grams). To put that in perspective, a cellphone contains around 200 to 300 milligrams (a milligram weighs about as much as a grain of sand). A laptop contains 750 milligrams to 1.25 grams. Photovoltaic technology is relatively young, but each year its use is growing rapidly. Just since 2000, the amount of silver consumed by solar-panel makers has risen an average of 50% per year. Demand grew from one million ounces in 2002 to 60 million ounces in 2011. Last year demand from the PV industry represented almost 11% of total industrial demand for the metal (excluding jewelry). According to statistics from CPM Group, demand grew by 11.2 million ounces, the strongest volume growth of all major sources (jewelry and electronics). And this was before the Japanese announcement was made.
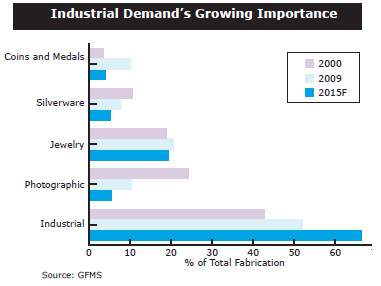
The largest end-user of solar panels is Germany, though that's changing. Last year Germany accounted for 27.3% of global installations, but due to subsidy cuts, solar-panel installation capacity dropped from 7.7 gigawatts to 7.5. In the big picture, that decline was offset by increases in China, France, Italy, the UK, Japan, and the US. In their 2012 Yearbook, CPM projected a slight decline in silver demand from solar panels due to a reduction of new installation in Europe and oversupply from excess production in China. But with the initiative from Japan, that estimate is almost certainly low. Japan Gives New Life to PV IndustryAfter the Fukushima disaster, Japanese authorities wanted to cut the nation's dependence on nuclear energy. Approximately 30% of Japan's power was generated by nuclear before the catastrophe; now the focus has shifted to other green energy alternatives, including solar. The new tariffs might work. The suggested rate of 42 JPY ($0.53) per kilowatt hour (expected to be maintained for 20 years) is more than twice the rate in Germany (€0.17 – or $0.246).Bloomberg estimates that this generous increase will create $9.6 billion investments in Japan alone. Here's what that amount of money would do to the sector: There were approximately1.3 gigawatts of solar capacity installed in 2011, but experts anticipate that number to nearly double to 2.3-2.5GW for 2012, and hit 3.0GW in 2013. According to SolarBuzz, Japan could see 28GW of solar capacity installed by 2020 and 50GW by 2030. That's a lot of solar panels, and – even assuming improved efficiency – it'll take a lot of silver. Price FactorsDuring recent years, solar panels have become significantly less expensive and more end-user friendly. However, the fact that each panel contains a lot of silver can make it susceptible to large price fluctuations. If the silver price gets too high, manufacturers might seek alternatives, of course, but they can't easily eliminate use of the metal. And if the product gets too expensive, demand could fall. Companies are already looking for ways to reduce the amount of silver used in PV panels or to replace it with another element. At the moment there are two main solar panel technologies on the market. The traditional one is "thick film," where silver is the main component. The other one is a less-expensive "thin-film" method which replaces silver with another material, cadmium telluride. The development of thin-film solar panels has picked up due to its lower price, but the technology is less effective. Thick film is more efficient in gathering energy from the sun, and this type of panel still prevails on the market. CPM reports that it accounted for roughly 91% of total installations last year, and analysts expect thick-film panels to maintain their dominance for at least the next several years. Further, both panel types use silver outside of the cell for reflectivity and other functions, so the odds of silver being eliminated from solar panels entirely are very low at this time. For investors, this means that at least in the near term, the solar industry will continue to use silver-intensive technology, thus supporting growing industrial demand for the metal. But that's not all, folks… New Era for Silver UsageFor a long time, silver industrial demand was dependent almost entirely on one industry: photography. Silver-based camera film dramatically changed the structure of silver demand at the beginning of the 20th century. By that time, silver had primarily been used in silverware, jewelry, and as money. At its peak, photographic demand accounted for about 50% of the market. But this is the 21st century, and in spite of substantial declines in film use, the modern world has developed many other important uses from silver's unique properties. Probably the most important shift is that industrial demand for silver no longer comes from a single field, but from numerous applications – almost too many to count – virtually none of which show any signs of slowing. This fact makes the forecast for silver demand more positive and stable; when one industry drops, others may offset the decline. Here's a smattering of uses, many of which are still in their infancy:
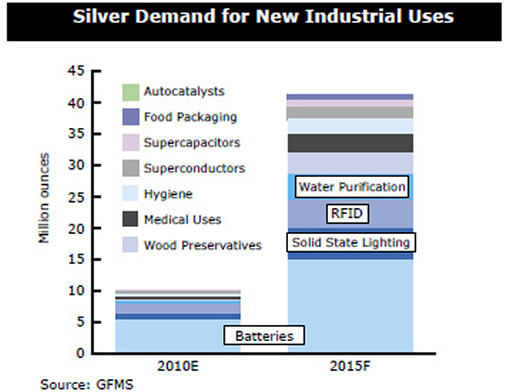
Though the total contribution from these new silver uses is relatively modest, the Silver Institute rather dryly forecasts that "there is a potential for a number of these segments to boost their silver consumption." As you can see in the chart below, its forecast for silver demand for new industrial uses projects that the biggest increases will be in batteries, SSL, and RFID.
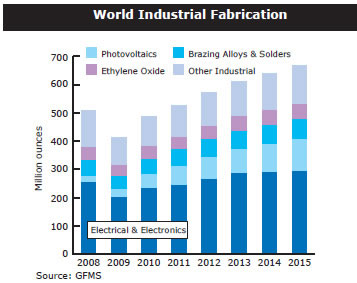
The primary uses for silver are growing, too. For example, the automobile industry is increasing consumption, due to both increases in the number of vehicles manufactured and the expanded use of electrical contacts. As the number of improvements in vehicles increase, so does the amount of silver used. For example, silver is used to control seat and mirror adjustments, windshield wipers, and manage navigation systems. Based on their research, the Silver Institute forecasts that industrial usage will rise to 665.9 million troy ounces by 2015 and account for more than 60% of total fabrication demand.
What It Means for InvestorsSince half of silver demand is for industrial purposes, it can act like an industrial metal in addition to its precious metal component. This means it's susceptible to more forces than gold, making it more volatile as well as more difficult to predict its future price. Conclusions:
The bottom line on the above is that the growing number of industrial applications for silver represents a long-term shift in this market. Increasingly diverse usage is not only here to stay but will continue to grow, supporting the price and impacting the balance of supply and demand. For investors, the thing to keep in mind is that while long-term prospects for silver prices are extremely bullish, to the degree prices are driven by this increased industrial demand, they are vulnerable to economic correction/contraction in the short term. Invest accordingly. With all it has going for it, silver offers investors some of today's best profit opportunities. But buying bullion isn't the best way to play silver's resurgence. Here's a far better strategy... © 2012 Copyright Casey Research - All Rights Reserved
You're receiving this Email because you've registered with our website. How to Subscribe Click here to register and get our FREE Newsletter To access the Newsletter archive this link Forward a Message to Someone this link To update your preferences this link How to Unsubscribe - this link
The Market Oracle is a FREE Financial Markets Forecasting & Analysis Newsletter and online publication. | |||||||||||||