Going Beyond the Proton Gradient - Stocks Stealth Bull Market Analysis 2013 Part1Stocks Stealth Bull Market 2011 Ebook Direct Download Link (PDF 2.8m/b) Interest Rate Mega-Trend Ebook Direct Download Link (PDF 2.3m/b) Inflation Mega-Trend Ebook Direct Download Link (PDF 3.2m/b) Dear Reader The stock market has so far put in a spectacular bull run during January 2013 by putting in a series of new stocks bull market highs across virtually every major indices and this taking place whilst the hottest stock of 2012 having collapsed by 1/3rd - Apple. No one could have imagined that the major stock market indices could make a series of new bull market highs whilst the biggest cap stock was in free fall! Where Apple is concerned it is clearly a case of Samsung having pricked Apple's stock price bubble that looks set to have much further to deflate.
If the stock market momentum continues at the current pace then the stock market will be up by more than 50% for the year! Off course that is not going to happen, realistically no matter how good such a move would be for our stock portfolio's, I am pretty confident that this mature bull market (near 4 year old) is unlikely to see the stock market up 50% for 2013, especially as the major indices are homing in on major psychological levels such as Dow 14,000 (last 13,954) and my long standing target of 14,200 (Stocks Stealth Bull Market ebook March 2011). Another point to note is that the rally underway has witnessed delusional bears right across the globe literally being seen as foaming at the mouth as illustrated by the diatribe that continues spew out of commentary of an always imminent bear market, crash, collapse etc... When the reality is that not only have they and everyone who listened to them missed out on what is a stocks bull market that is approaching the END of its FOURTH YEAR ! But that have been actively betting against an exceptionally strong recent bull run that is the exact mirror image of the crash that they have been so furiously proclaiming as always being imminent. Stock Market 2012 Quick Review The Dow closed up a healthy 7% for 2012 at 13,104, whilst other major indices adding substantially more such as S&P: up 13% and Nasdaq up 16%, with the UK FTSE trailing with a 6% gain.
Stock Market 2012 First Half Strategy In terms of the long-term view my analysis of March 2011 (Stock Stealth Bull Market Ebook) (FREE DOWNLOAD) concluded in a target of Dow 14,200. However as regularly indicated since Mid December 2011, in view of expectations for a tough year for a maturing stocks bull market during 2012, my strategy for the first half of 2012 had been to cut my net long exposure to the stock market from about 40% of assets (Dec 18th) by distributing into the anticipated rally into late April / Early May 2012 as indicated by the analysis and forecast of Feb 2012, which resulted in substantially cutting my exposure to the stock market by mid year. By June 2012, in the wake of the subsequent sell off my expectations were once towards a continuation of the bull market during the second half of the year towards bull market highs as illustrated by my analysis and concluding trend forecast at that time - 16 Jun 2012 - Greece Election Eurogeddon Stock Market Trend Analysis and Forecast
Simple Investing Strategy My investing strategy for the duration of the bull market has been fairly simple, as I have repeated countless times over the years, which is that the greater the deviation from the bull market high then the greater the buying opportunity presented. See the Stocks Stealth Bull Market ebook (Free Download) for examples of how one should perceive price action during multi-year trends. Fundamental Inflationary Background The fundamental background remains of ever expanding waves of highly inflationary central bank money printing liquidity that washes over all markets. Deflationists such as Krugman and his disciples bang on and on about deflation, about destruction of demand, that will result in deflation, about debt deleveraging that will result in deflation. What the deflationists remain blind to is the fact that the central banks such as the Fed, and the Bank of England have been stuffing every orifice of the deleveraging banks with free money ( US alone has stuffed its banks with over $2 trillion of support) which results in artificial profits as the banks risks / debts are being systematically transferred to the central banks balance sheets. Which is WHY FALLING DEMAND and FALLING WAGES are NOT resulting in Deflation! because in totality, there HAS BEEN NO DEBT DELEVERAGING, TOTAL DEBT IN FACT CONTINUES TO EXPAND as central banks MONETIZE GOVERNMENT DEBT and in some cases EXPOENENTIALLY. And not only that but money printing AKA QE is far worse for an economy than Debt money (bank created credit) because it REALLY has just been conjured out of thin air with no economic activity to justify its creation. This is why prices WILL rise, ALL prices including asset prices because of central bank QE which should not just be seen as free money for the banks but direct deliberate debasement of the currency. Unlike bank credit It WILL NEVER be destroyed instead feeds the Inflation Mega-trend which I termed in March 2009 as QE really being Quantitative Inflation. I know this may be getting rather complicated, so if you want to understand only one thing, know this that money printing by central banks is highly inflationary, highly corrosive to the purchasing power of a currency, which is why despite all of the academic reasons why we 'should' have deflation in reality we have INFLATION. The Exponential Inflation Mega-trend The US and every other nation is emerged in what is an exponential inflation mega-trend which the below graph clearly illustrates that even on the official CPI inflation measure (which tends to under report real inflation), that the US is no different to any other country which contrary to the delusional deflation propaganda is instead immersed in what has always been an exponential inflation mega-trend where vested interests have instead been blindly regurgitating the threats of deflation ever since the Great Recession of the 2008-2009, which the graph clearly illustrates amounted to nothing more than a mere blip or as I warned of at the time as being a mere deflationary ripple on the surface of an ocean of Inflation.
The Inflation Mega-trend Ebook of Jan 2010 (FREE DOWNLOAD), re-iterated that asset prices tend to be LEVERAGED to Inflation, which is precisely the trends that have subsequently transpired from stocks to commodities such as Gold and as I have been flagging during 2012, is expected to transpire US and other housing markets so it does not really matter if actual inflation is far higher than official inflation which means it is not necessary to focus on alternative inflation measures if one acknowledges that asset prices tend to be leveraged to official inflation data that go through the stages of being over sold or over bought against inflation due to the impact of investor sentiment. Again note that the Inflation Mega-trend is EXPONENTIAL, and no matter how loudly the delusional deflationistas scream for always imminent DEFLATION, it is just NOT going to happen, if anything government actions i.e. QE-4EVer is going to result in the ratcheting higher of the the Inflation Mega-trend going forward. Frankly, I just do not understand why so many people that purport to be experts on the financial markets can remain so blind to what is blatantly so obvious. The only logical conclusion is that they never put their own money on the line and thus never face the financial consequences (PAIN) for being wrong, for had they followed their advice such as betting against a near 4 year bull market then they would have already bankrupted themselves several times over by now, but instead merrily go around spouting what amounts to nothing more than verbal diarrhoea. Fortunately for them I don't see it as my job to expose the abysmal record of media whores who tend to spend more time in front of TV camera's than trading screens. Money Printing QE-4-EVER The US Fed's efforts to put a floor under the US economy so that the banks stop being bankrupt, QE3 which started at $40 billion per month as an escalation of the policy for the transference of bad loans / defective mortgages from the bankers and onto the tax payers by way of the electronic money printing presses. This was added to in December 2012 by the Fed announcing it would also buy £45 billion of US Treasury bonds per month as it monetize's / effectively cancels US debt in a similar manner to that which the UK is engaged in as illustrated by the below graphic (Bank of England Cancels Britain's Debt)
Briefly, QQE amounts to the Fed returning the interest received on the US Treasury Bond it holds back to the US Treasury, which effectively means that debt has been cancelled (effectively, not actually) and therefore the US over time will have an effective falling Debt to GDP ratio whilst the actual Debt to GDP Ratio suggests otherwise. This is what I termed 6 months ago as the Quantum of Quantitative Easing the price for which is INFLATION as the Fed is effectively funding virtually the whole US budget deficit by printing money for nothing. Many commentators in the mainstream press such as in the FT stated that QE3 it is deemed to fail, and others question how can this spark an housing bull market. However, academics and journalists, who are not exposed to market forces fail to comprehend that market trends are made at the margins, for instance the difference between a recession or economic boom is little more than 3% of GDP, which is marginal to total GDP but has a far greater impact on all aspects of life. Where the markets are concerned marginal impacts have a far greater effect on market trends because of the fact that most people are only ever aware of these tips of the Ice-Bergs, i.e. all of the statistics that tend to get bandied about are mere tips of the financial ice-berg that is the $1 Quadrillion derivatives markets ($1000 trillion), which is why the reaction of asset prices is leveraged to Inflation that is the consequences of perpetual money printing in all of its form no matter whether its called QE3, or Open Market Operations, or Loans to the banks, or government debt printing (bonds), all of these actions are Inflationary, and it is marginal changes in the Inflation rate that is leveraged by the derivatives market Ice-bergs that sets trends in motion that act to feed upon them selves all the way to the NEXT bubble stage. Another factor to consider is speculators from individuals to the mega- investment banks see what the Fed is doing and are attempting to discount future market action to this ongoing policy of market manipulation by the Fed, by reacting far beyond that of the nominal amount of $85 billion suggests, which is one of the reasons why the stock market is rising as the trend feeds on itself. How Can the Stock Markets Keep Going Higher .....? Over the past 3 years, this is the question that I most often get asked, how can the stock market go up when we are in a recession, depression, debt crisis etc....
Every component of our economic system is corrupt and geared towards funneling wealth towards the elite, and all I attempt to do is to try and ride on the coat tales of the elites dark pools of capital as they manipulate the markets as I stated right at the beginning of the stocks stealth bull market in March 2009 - Stealth Bull Market Follows Stocks Bear Market Bottom at Dow 6,470 The markets ARE manipulated, once you as a small investor come to agree with this statement then you can take the necessary steps to prevent yourself from being wiped out by ALWAYS keeping this in mind that Manipulated markets WANT you to act in a certain manner at certain times, they want you to buy into the latter stages of a bubble as the manipulators distribute, and the market manipulators want you to SELL into Market Bottoms and early bull rallies when the manipulators are accumulating. The reason why stocks will rise is because the system is corrupt, the markets are manipulated. The regulators and the politicians are corrupt, which is why the banks were bailed out, privatised profits, nationalised losses, why we have zero interest rates, why the government prints money (debt / QE / Loans), and the mugs are ordinary tax payers. You pay the price for systemic corruption, you pay for the bailouts whilst the bankster's collect bonuses for fictitious profits. You pay for the regulators who operate a revolving door with the bankster institutions, it is not by accident the regulators were snoring whilst the banks were committing fraud. You pay for the politicians who after leaving office go work for bankster's. You pay for the fraud as it manifests itself in exponential inflation. We are all slaves and 99% are not even aware of their slave status! The politicians need the bankster / elite money to get elected. The politicians know their term in office is limited i.e. they could be voted out at the next election so as soon as they get elected they start working on what they will do when they get voted out so work towards that goal by favouring the elite in their policies, which is why the tax payer bailed out banks have NOT been nationalised. We the tax payers OWN the big banks but have NO control over them! That is FRAUD! THE ELITE OWN THE POLITIIANS OF ALL PARTIES! Which is one of the reasons why academics keep getting it wrong, keep banging their heads on the deflation brick wall because they cannot comprehend how fraudulent the system truly is. It is beyond the parameters of their universe because they are PARTY to the FRAUD! They are PAID vested interests to help keep the tax payers effectively sedated for if they truly understood the truth of the fraudulent money printing debt slavery system then there would be a revolution. There would be no more trips for the likes of Prince Harry to go off on an safari to Afghanistan to kill brown people etc.... The apparatus of the state exists to perpetuate the fraud. The intelligence agencies exist to perpetuate the fraud.the whole public sector exists to perpetuate the fraud. The state schools exist to perpetuate the fraud to churn out docile debt slaves to work for there elite master's. Don't take my word for it, analyse how you as tax payers work ever harder for ever decreasing disposable income, where you are forced to fill the gap with debt, i.e. you are forced to become a debt slave. This is not by accident this is as a consequence of from cradle to grave conditioning. Virtually All government produced economic statistics are fraudulent - Of course real inflation is far higher than official CPI inflation, I know that and so do you when you do your weekly shops! For instance, I estimate current real UK inflation to be at 4% against official CPI of 2.7%. That may not sound like much of a difference but compound it over a decade or so and that explains why your rising (if your lucky) wages are unable to buy the same amount of goods in the shops let alone more. That's the point about the inflation theft, it is meant to be STEALTH. The same goes for all other major economic statistics that Economists tend to ecstatically convulse over - Take GDP, the government SPENDS to inflate GDP without any real productive output, not worth even 1/10th of the amount spent, and it is this that causes inflation because government activity consumes resources without generating productive activity. Spending billions or even trillions as with the case with the Iraq War, to send thousands of troops over seas to kill brown people may boost domestic GDP via the military industrial complex, but it is not productive activity which is why it causes INFLATION. The government seeks to consume all productive wealth created by the private sector on highly propagandised unproductive activities such as wars , bureaucracy, creating a benefits hand-outs voting class, the NHS and on and on... This is despite all of the technological innovation of the past 40 years, ordinary people today have to work far harder then their predecessors did for a similar quality of life, instead technological innovation should have resulted in a majority leisure life-style by now, after all that was the forecast from the early 1980's that the technology would so boost human productivity that it will mean we will all only need to work about 10 hours a week by now and spend the rest of the week enjoying ourselves in leisure activities. What these forecasters forgot was that the thieving scum bags on capital hill and at Westminister would steal virtually all of the gains in productivity and transfer it to vested interests and the elite. The bottom line is that governments need the money printing fraud that politicians justify the expansion of through the public sector election bribes and reinforced by wars without end as George Orwell so eloquently put it - The war is not meant to be won, it is meant to be continuous. Hierarchical society is only possible on the basis of poverty and ignorance. This new version is the past and no different past can ever have existed. In principle the war effort is always planned to keep society on the brink of starvation. The war is waged by the ruling group against its own subjects and its object is not the victory over either Eurasia or East Asia, but to keep the very structure of society intact So the governments will continue to print debt and money to buy votes and make wars to justify their existence and expansion the consequences of which is for ever expanding taxes and the inflation stealth theft of wealth and purchasing power of earnings. Unfortunately most people remain sedated as they swallow the propaganda from vested interests across the mainstream media and broader hollywood programming, as they load themselves up with debt and then become focused on working for the elite to to service the debt for the rest of their lives as each election they put their mark against the party who offers them the biggest bribes (a part of their own money back). So yes, assets that are not so easily printed will continue to leverage themselves to the money printing inflation fraud that will continue to exist whilst big spending governments exist ( as a high % of GDP). Mainstream Broadcast Media The Reason Why 90% of Traders Lose Those that follow the prevailing doom and gloom in the mainstream broadcast press will be under the impression that we must have been in a severe bear market, instead the reality has been the exact opposite, a severe bull market has been underway for 4 years now that the mainstream press has all but missed if not actively been implying the opposite, be it the latest diatribe that suggested the markets would collapse following Obama's re-election, or the prospects for eurogeddon for the whole of 2011 AND 2012. This reinforces a fundamental point that whilst the mainstream press collectively remains clueless to bull trends underway then those trends are likely to continue. Conversely when the mainstream press is actively seen as turning bullish on an asset class then the time has come to SELL. I have explained the reasons why this is so countless times over the year so will refer to an earlier article on this subject that explains a wider truth of Why 90% of Traders Lose. The failure rate for financial market and commodity traders has remained at a consistently high 90% for many decades, this despite all of the advances in information technology and the flood of new learning materials that is churned out annually, therefore why is it that 90% of traders still lose ? In my opinion, a high 90% of traders are destined to lose because they are in fact learning from / listening to the 90% of losing traders that preceded them, who following wipe out in the markets have gone on to focus on writing about market price action and methodology with an even greater concentration observed to occur in the mainstream press as account busted traders / investors turn failure to trade into full time media careers and thus perpetuate a continuous cycle of failing traders guiding new traders towards similar failure. This explains why those in the mainstream financial press can literally miss WHOLE Bull and Bear markets despite trends that end up spanning many, many years. They can be recognised by their rhetoric such as the perpetual the end of the trend is coming mantra that is based on fundamentally flawed understanding of what actually moves markets, which is why they failed to succeed in trading in the first place. Given that 90% of trader fail, it can be assumed that that at least 90% of those that provide financial commentary are failed traders that spend their time writing about the act of trading rather than ever engaging in actual trading which culminates in the big name media whores that we see prancing around between make up rooms and TV Studio's, usually regurgitating what other failed traders have already commentated upon or make such weak statements that can be easily applied to virtually any outcome i.e. that the market will definitely fall, but then again it may definitely rise. The media whores are well practiced in applying such phraseology that ensures that they can always claim victory for publicity purposes whatever the actual outcome is, as the viewers are left to perceive whatever they want to in the media whore sales men's commentary, based on their own pre-existing market bias. The mainstream financial media is more than eager to push the selectively edited past commentary that results in nothing more than blatant misleading advertisements masquerading as financial market commentary. Stop for a moment and dissect what the latest utterance of a media whore actually is and you will soon realise the game of deception that is being played in an attempt to hook you in towards ultimately purchasing a product or service. In actual fact perhaps as little as 1% of the material floating out there is produced by successful traders because successful traders are primarily going to be focused on trading rather than writing about trading or marketing trading services, with probably only enough spare time to write a couple of books over their whole lifetime which compares against the book factories that can churn out as many as several titles per year that virtually ensures that at least 95% of your trading book shelf is packed full of garbage, totally useless, and you know it! Still it could be worse, academic economists inhabit a zone that is based purely on mumbo jumbo that is guaranteed to result in unforeseen outcomes, for academic economists tend to be the second greatest media whores just a step down from politicians, who exist purely to give off the air of authority and certainty as though economics is a science when in reality it is pseudo science more akin to the art of psychologically managing the general populations expectations aka economic propaganda than in determining any sense of economic reality. Economic theories are just that theories that have been modeled on selective editing of past economic data for political purposes which every trader should know (failing or successful) is just over optimised back fitting onto selective past trends that proves totally worthless going forward. Corporations Create Wealth, Government's Consume Wealth The bottom line is this that wealth can only be created by means of competitive productive activity, the greater the competition the more productive the activity. Whilst for governments the objective is to expand uncompetitive unproductive activities which is what the public sector that seeks to consume wealth. The most extreme manifestation of this is the military that we have all so successfully been brainwashed to embrace as hero's to look upto as they go around playing drone wars or flying apache gun ships. Note that military activity is the greatest wealth destroyer mankind has created, far surpassing government bureaucracy, for all empires are ultimately destroyed through military over stretch, that is why the empires of past such as the Roman and British Empire's collapsed as the military destroyed more wealth than the private sector was able to create. For empires such as the Soviet Union was even more crippled because their productive capacity came from keeping virtually the entire population as slave workers, even that was not enough to prevent military meltdown as the military industrial complex sought to consume all of soviet unions productive capacity that resulted in its destruction. So we have wealth destroyers - the Military, Wealth wasters - the Public Sector and the Wealth creators competitive private corporations (not to be confused with monopolies or bailed out banks). Therefore if you want to increase your wealth then you need to be exposed to the competitive wealth creators, selecting sectors and individual stocks that are most geared towards wealth creation such as Tek Stocks, commodities, and other innovators. The bottom line is that the wealth creators, cloth, feed, and entertain us. Without whom we would be where the Russian people were during the 1980's, the Chinese people were in the 1970's and the British people were in the late 17th century before the most potent force that mankind had invented emerged - Competitive Capitalism! Something that the British governments successfully nurtured that resulted in Britain being able to finance the largest empire in history. That during the 20th century successive British governments have sought to corrupt with increasing socialism that translates into getting something for nothing, that has led to today's position where Britain has let itself become a small Island adrift in the Atlantic ocean that amounts to nothing more than an air-craft carrier for the United States Military Empire. Clearly Capitalism is more than just an human idea, it is a force of nature, for it has its roots in the ultimate form of competition which is evolution, survival of the fittest, stress literally breeds innovation, competitive life seeks to spread to every corner of the globe. It should be the governments job to nurture competitive capitalism not subvert it with socialism that seeks to reward incompetence, seeks to bailout the bankrupt, seeks to avoid cleansing of malinvestments from an economy. Big government IS the reason why we are ALL suffering today! Why we have Inflation! For without big government socialism then we would have DEFLATION as innovation results in FALLING prices, but instead we have EXPONENTIAL INFLATION as a consequence of the FRAUD that is the Government ! 6 MILLION PEOPLE in BRITAIN are PARTY to the FRAUD! (public sector works). A further 8 MILLION PEOPLE who could work are instead kept sedated on benefits, wasting their whole lives away. THAT IS THE REASON FOR OUR ECONOMIC CRISIS. You want to see the mother of all economic booms ? Scrap the public sector and cut the benefits and see what happens to the economy! But no greedy lazy, good for nothing fraud perpetuating politician is every going to go down that route instead all they will ever do is grow the size of the state, all the way towards bankruptcy. In Summary The Competitive Private Sector Creates Wealth and Deflation (Falling Prices) The Uncompetitive Public Sector Consumes Wealth and Creates Inflation The Government left to its own devices will seek to consume all of the wealth in an economy i.e. bankruptcy, that is most likely to manifest itself as an hyperinflation panic event. Next I will explain why despite everything I have said above, we are NOT doomed! You Want to Know the Future of innovation ? Look to the past. The water and steam engine revolutions of centuries past show the direction for future innovation will be in levers and motors for future machines, only that these machines will be on the nano scale. Therefore that is the direction that investors need to research for greatest leverage to future competitive wealth creating technologies such as nano-technology, levers and motors, the building blocks for nano-machines, and nano-machines will become self-replicating that will seek to change the whole world, just as the internet has. The wealth that this will create will be exponentially greater than all of the wealth that has been created to date, as an example the nano-tech world will be as we today look back at the pre-personal computer world of less than 40 years ago. When we watch a 1970's movie we automatically wonder at how bare their existence was, where's the mobile phone, where are all of the computing devices ? That is how we will see today 30 years from now ! And thus the wealth this creates 'should' be more than enough to be able to feed the wealth consuming monster that is big government. Then armed with nano processing devices that are exponentially more powerful than today's super computers we will answer the really big questions! Such as - What is Life ? Not some babbling's contained within ancient scripture written to control the masses towards an elites agenda. But what IS life at its very core. To know the answer to that we will CREATE life and I am not talking about today's technology of genetic engineering but creating life right from its very first spark! Which is important because it opens up the possibilities of creating life that is completely alien to that which exists on earth today i.e. life that is metallic rather than organic. The past decade has already revealed what organic life is and how it began but lacks the technology to experience its actual creation. However 30 years from now, we will likely find that high school children will be able to CREATE LIFE as part of their science projects! Again What is life? Simply, Life is energy! The transformation of energy as per the laws of physics - 4 billion years ago proton gradients drove the conversion of carbon dioxide into organic molecules and the rest is as they say history. A recent BBC programme "Wonders of Life" illustrated the process in an excellent non technical manner, which may still be available on BBC iplayer. Future technologies will result in an exponential increase in human productivity because we will be able to re-create what took 4 billion years in a matter of days or even hours, which will set the scene for the yet to be named new sciences and spark the next technological revolution after nano-tech, one that will be centred around creating life from the ground up, right from the first spark and thus giving it properties not found in nature today. So the debt deflation collapse merchants that keep their eye on the likes of the government debt statistics will remain waiting for an always imminent collapse for what will seem like an eternity. Again it is important you understand the overall big picture of one of exponential inflation as a consequence of government money printing fraud and the technological human productivity boosting mega-trends brought to competitive markets around which asset price booms and busts oscillate ever higher. Survival of the Fittest Therefore investors need to protect themselves from Government wealth consumption (taxes) and inflation (loss of purchasing power) by channeling their wealth into assets that are leveraged to wealth creating innovation (technology stocks) and are tax efficient such as ISA's in the UK. Stock Market Mega-trend
In part 2 (this week) I will seek to conclude in a detailed trend forecast for the stock market for the whole of 2013, ensure you remain subscribed to my always free newsletter to get this and other detailed trend forecasts in your email in box. In the meantime, if you have not already done so then check out my other recent concluding trend forecasts for 2013.
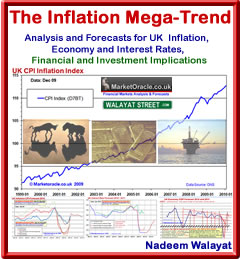
Source and Comments: http://www.marketoracle.co.uk/Article38751.html Nadeem Walayat Copyright © 2005-2013 Marketoracle.co.uk (Market Oracle Ltd). All rights reserved. Nadeem Walayat has over 25 years experience of trading derivatives, portfolio management and analysing the financial markets, including one of few who both anticipated and Beat the 1987 Crash. Nadeem's forward looking analysis focuses on UK inflation, economy, interest rates and housing market. He is the author of three ebook's - The Inflation Mega-Trend; The Interest Rate Mega-Trend and The Stocks Stealth Bull Market Update 2011 that can be downloaded for Free.
Disclaimer: The above is a matter of opinion provided for general information purposes only and is not intended as investment advice. Information and analysis above are derived from sources and utilising methods believed to be reliable, but we cannot accept responsibility for any trading losses you may incur as a result of this analysis. Individuals should consult with their personal financial advisors before engaging in any trading activities.
You're receiving this Email because you've registered with our website. How to Subscribe Click here to register and get our FREE Newsletter To access the Newsletter archive this link Forward a Message to Someone this link To update your preferences this link How to Unsubscribe - this link
The Market Oracle is a FREE Financial Markets Forecasting & Analysis Newsletter and online publication. | ||||||||||||||

Wednesday, 30 January 2013
Going Beyond the Proton Gradient - Stocks Stealth Bull Market Analysis 2013 Part1
 My quick answer is because they will keep printing money, which causes inflation and inflation is the stealth theft of wealth and purchasing power of a system that has its basis in fraud. If the person is still listening then I explain that the whole system which includes the stock and other markets is fraudulent. We do not live under capitalism we live under a fraudulent money printing bankster system. The politicians are in the back pockets of the bankster elite.


Wednesday, 16 January 2013
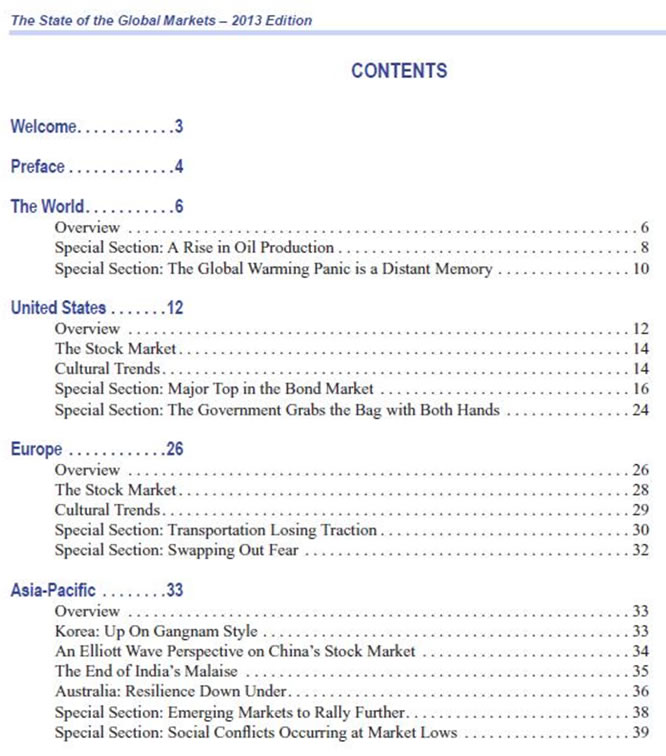
The State of the Global Financial and Commodity Markets 2013
The State of the Global Financial and Commodity Markets 2013 |

| Subscription |
You're receiving this Email because you've registered with our website.
How to Subscribe
Click here to register and get our FREE Newsletter
To access the Newsletter archive this link
Forward a Message to Someone this link
To update your preferences this link
How to Unsubscribe - this link
| About: The Market Oracle Newsletter |
The Market Oracle is a FREE Financial Markets Forecasting & Analysis Newsletter and online publication.
(c) 2005-2013 MarketOracle.co.uk (Market Oracle Ltd) - The Market Oracle asserts copyright on all articles authored by our editorial team. Any and all information provided within this newsletter is for general information purposes only and Market Oracle do not warrant the accuracy, timeliness or suitability of any information provided in this newsletter. nor is or shall be deemed to constitute, financial or any other advice or recommendation by us. and are also not meant to be investment advice or solicitation or recommendation to establish market positions. We recommend that independent professional advice is obtained before you make any investment or trading decisions. ( Market Oracle Ltd , Registered in England and Wales, Company no 6387055. Registered office: International House, 124 Cromwell Road, Kensington, London, SW7 4ET, UK )
Saturday, 12 January 2013
U.S. Housing Real Estate Market House Prices Trend Forecast 2013 to 2016
U.S. Housing Real Estate Market House Prices Trend Forecast 2013 to 2016
Interest Rate Mega-Trend Ebook Direct Download Link (PDF 2.3m/b) Inflation Mega-Trend Ebook Direct Download Link (PDF 3.2m/b) Dear Reader Following the peak of the over leveraged US housing market bubble late 2006, the real estate market literally crashed during 2007 triggering the financial crisis that has acted to subsequently feed a multi-year bear market as a consequence of the subprime mortgage debacle that was magnified globally via toxic CDO packages that literally risked the bankruptcy of the whole global financial system starting in June 2007 when Bear Sterns bailed out one of its hedge funds, within a year Bear Sterns would effectively go bust as JPM picked it up for about 5% of its peak value that acted as a prelude to what was yet to come during 2008 for the likes of Lehman's that prompted tax payer bailouts right across the globe to prevent financial armageddon as the too big to fail banks only slowly revealed the extent to their exposure to the toxic mortgage backed securities in what amounted to the greatest fraud in history as investors had been duped into buying junk that the credit rating agencies typically rated as Triple A for a fee.
However, one of the best times to invest in an asset class is when it is at it's most hated, i.e. after a crash and a prolonged bear market when most investors have been badly burnt by losses, the US housing market and many other global housing markets such as the UK fit the bill for the potential for being at such an opportune moment during 2012 due to similar money printing asset price inflating government policies as I have been flagging for most of 2012 for expectations of the UK and US specifically to have entered into embryonic bull markets that this analysis seeks to expand into a detailed multi-year trend forecast. 06 Sep 2012 - Super Mario Draghi Triggers Stocks Stealth Bull Market Rallies to New Bull Market Highs This years convergence towards housing market bottoms such as the UK and US presenting one of those once in a couple of decades opportunities to climb aboard what still are embryonic bull markets, just as I strongly suggested the birth of a new multi-year stocks stealth bull market in March 2009 Revisiting US Housing Market Forecast 2008-2010 It has been four long years since I last analysed the US housing market due to lack of personal exposure to this market. My last forecast (29 Jun 2008 - US House Prices Forecast 2008-2010) concluded in a forecasts for a continuing bear market for another 2.5 years into the end of 2010 as illustrated by the below original graph -
US House Prices Forecast Summary - Nominal US House Prices are forecast to fall by 30% from the Mid 2006 peak by the end of 2010, or a further 11% on the decline of 19% to date. US house prices will continue falling in real-terms even if a low in nominal house prices is made by mid 2010. Actual outcome - The forecast for the Case shiller index to fall from 181.5 down to 158.7 over the subsequent 2.5 years, compares against the actual October 2010 index of 157.50, which virtually matches forecast expectations. Whilst the actual trend was more severe with the original support trendline containing the decline and subsequent uptrend.
The analysis of June 2008 also gave the conditions for when a buy trigger would be initiated that had it's basis in the prevailing Inflation Mega-trend i.e. in terms of when US house prices would start to rise in real terms, and concluded that that no such a buy trigger was likely to occur during the following 2.5 years (into the end 2010) -
When to Buy? - The time to start contemplating buying real estate again will be after the US housing market has made a nominal bottom in house prices and at the time US house prices start to increase in real-terms as the BUY / SELL signals above illustrate. As per this analysis there is no sign of a BUY trigger occurring within the next 2 1/2 years. Money Printing QE-4-EVER The US Fed's latest efforts to put a floor under the U.S. housing market so that the banks stop being bankrupt, QE3 which started at $40 billion per month as an escalation of the policy for the transference of bad loans / defective mortgages from the bankers and onto the tax payers by way of the electronic money printing presses. This was added to in December 2012 by the Fed announcing it would also buy £45 billion of US Treasury bonds per month as it monetize's / effectively cancels US debt in a similar manner to that which the UK is engaged in as illustrated by the below graphic (Bank of England Cancels Britain's Debt)
Briefly, QQE amounts to the Fed returning the interest received on the US Treasury Bond it holds back to the US Treasury, which effectively means that debt has been cancelled (effectively, not actually) and therefore the US over time will have an effective falling Debt to GDP ratio whilst the actual Debt to GDP Ratio suggests otherwise. This is what I termed 6 months ago as the Quantum of Quantitative Easing the price for which is INFLATION as the Fed is effectively funding virtually the whole US budget deficit by printing money for nothing. Many commentators in the mainstream press such as in the FT stated that QE3 it is deemed to fail, and others question how can this spark an housing bull market. However, academics and journalists, who are not exposed to market forces fail to comprehend that market trends are made at the margins, for instance the difference between a recession or economic boom is little more than 3% of GDP, which is marginal to total GDP but has a far greater impact on all aspects of life. Where the markets are concerned marginal impacts have a far greater effect on market trends because of the fact that most people are only ever aware of these tips of the Ice-Bergs, i.e. all of the statistics that tend to get bandied about are mere tips of the financial ice-berg that is the $1 Quadrillion derivatives markets ($1000 trillion), which is why the reaction of asset prices is leveraged to Inflation that is the consequences of perpetual money printing in all of its form no matter whether its called QE3, or Open Market Operations, or Loans to the banks, or government debt printing (bonds), all of these actions are Inflationary, and it is marginal changes in the Inflation rate that is leveraged by the derivatives market Ice-bergs that sets trends in motion that act to feed upon them selves all the way to the NEXT bubble stage. Therefore, before I receive a string of comments stating that x,y,z economic indicator is weak so house prices cannot possibly rise. The primary indicator to watch is Inflation because whilst we do not know to what the exact the reaction of the derivatives market will be, i.e. where the flood of money will exactly flow to, however I do know that it will be leveraged to far beyond the nominal extent implied by the annual rate of change which in itself tends to mask the exponential rate of Inflation, i.e. the official inflation rate of 2% compounds each year. All central banks understand this, which is why the Fed is specifically targeting mortgage backed securities that are leveraged many times over ny derivatives, $85 billion a month / $1 trillion per year will probably have an impact on the financial system of many times that amount. Another factor to consider is speculators from individuals to the mega- investment banks see what the Fed is doing and then attempt to discount future market action to this ongoing policy of market manipulation by the Fed, by reacting far beyond that of the nominal amount of $85 billion suggests, and it is this which sparks the change in trend that feeds on itself that this article seeks to evaluate in terms of the expectations for the US Housing market. U.S. Unemployment and House Prices Of all of the statistics a developed economies statisticians generate, the rate of unemployment is near the top of list of those that best reflect the true state of an economy which is why it factors so strongly in the politicking that goes on, in which respect both the Democrats and Republican are always busy putting their own spin on the latest U.S. unemployment data released by the BLS which shows that the US unemployment rate has held steady at 7.8% after having spent over 3.5 years above 8% and down from a high of 10% reached in October 2009. The Truth About the U.S. Unemployment Rate This analysis is sticking to the official standardised statistics produced by the BLS rather any of the political motivated statistics found around the net, the below graph illustrates the trend in the unemployment rate from 1992 to the present in terms of Presidency (06 Oct 2012 - High U.S. Unemployment Rate, Obama Failure or Bush Catastrophe for Romney to Continue?).
US Unemployment Rate Facts Clinton - Unemployment Rate fell from 7.2% to 4.2% - 3% Bush -Unemployment rate rose from 4.2% to 8.3% +4.1% Obama - Unemployment rate to date has fallen from 8.3% to 7.8% -0.5% The data clearly illustrates the extent to which the Bush presidency was a catastrophe for America as Bush handed Obama an economy that was literally in a state of free-fall, the consequences of which were that it took Obama some 10 months to bring the rate of free fall to a halt, with the subsequent recovery at a very similar rate of decent as that under the Clinton Presidency which suggests, should this trend continue the U.S. unemployment rate should fall to about 6.5% by the time of the 2016 election which suggests continuing Fed support. Historic Record A further look at the historic unemployment rates amongst previous Presidents shows that there is a clear tendency for Republican Presidencies to push up unemployment rates whilst Democrat Presidencies tend to cut the unemployment rates. The Truth About the Real U.S. Unemployment Rate During the election campaign many republican's such as Donald Trump were been busy pointing out that the real US unemployment rate is as much as double the official rate with figures typically offered ranging from 11% to 20%, which has some basis in fact as the actual total US unemployment rate referred to as U-6 stands at 14.7%, so many republicans are correct in claiming that the real rate of US unemployment is far higher than the official rate as the official rate only includes those that are actively seeking work. This figure does not include the unemployed who are not actively looking for work; nor does it factor in workers with part-time jobs who are seeking full-time employment. When these workers are included, the (U-6) un/underemployment rate nearly doubles to 14.7% that remains unchanged from the August figure. All Presidents tend to utilise this trick to under report the true level of official unemployment. The only way to gauge the level of corruption in the unemployment statistics is by taking a look at the official rate of unemployment relative to total rate of unemployment in percentage terms, where the lower the percentage the greater the level of corruption that tends to occur in the lead up to elections.
An analysis of the rate of corruption suggests that - a. the Bush regime during the last 3 years of it's Presidency was engaged attempting to maximise the level of corruption in the official unemployment statistics. b. That the Obama regime official statistics in the lead up to the 2012 Election increasingly became more on par with that of the Bush regimes efforts in the lead up to the November 2008 election i.e. Obama's Unemployment statistics are just as corrupt as that of President Bush. Therefore whilst the real rate of unemployment has reduced as both graphs exhibit a downtrend, the actual extent of the fall in unemployment is far less than the official statistics suggests. The reality is that the pre-election report was highly suspect, where the comparison against U6 does suggest it has been manipulated for electioneering purposes i.e. not by the BLS but via government policy to aim to mask real unemployment. Fed Targets Unemployment Rate The Fed further confirmed the expectations for a trend towards 6.5% in its December announcement that it had decided to target US unemployment rate down to 6.5%, which is a further example of the Fed escalating its response towards inflating the US housing market and economy and the central bank further taking its eye off of Inflation that will likely come back to bite the US over the coming years. What this effectively means is that the policies of Zero interest rates and money printing (QE) are set to continue until the US unemployment rate falls to or below 6.5%, which is mans for several more years. U.S. Unemployment and House Prices In the preceding analysis (as of 6th Oct 2012) we have determined whilst the long-term trend in unemployment is down and targets a rate of 6.5% by early 2016, however against this the unemployment rate is likely to experience upward pressure into mid 2013. Now firstly one needs to realise that the absolute figure is not as important as the trend as house prices are predominantly sentiment driven therefore the importance of the unemployment data is the psychological impact of rising or falling statistics have on market participants future expectations.
Key points that stand out -
The key conclusion is that US unemployment falling from 10% to 7.8% has acted to stabilise US house prices. With my expectations for US unemployment to fall to below 6.5% by 2016, this will act as an accelerant on US house prices i.e. US house prices response will be leveraged to increasingly LOWER rates of unemployment i.e. a fall from 7% to 6.5% will engender a greater response than a fall from 7.5% to 7%. Unemployment Rate Housing Market Drivers
US Economy - Ignore Debt Ceiling Drama Whilst Europe, the UK and many other major developed countries have stagnated the US has continued to show relative strength by registering 3.1% GDP (annualised) for Q3 2012, which puts the US on a trajectory for 2% growth for 2012. US GDP growth is expected to improve in the face of ever escalating waves of money printing and ignoring the smoke and mirrors games that the White House and Congress keep playing such as the Fiscal Cliff Drama and soon to see Debt Ceiling 'Crisis', the US looks set to add at least 2.5% GDP for 2013 and probably at least 3% for 2014. Which coupled with ZERO interest rates will continue to exert upward pressure on US house prices for at least the next 2 years. U.S. Exponential Inflation Mega-trend GDP Growth of 2.5% 2013 say hello to real inflation of about 3.5% which illustrates why the US and every other nation is emerged in what is an exponential inflation mega-trend which the below graph clearly illustrates that even on the official CPI inflation measure (which tends to under report real inflation), that the US is no different to any other country which contrary to the delusional deflation propaganda is instead immersed in what has always been an exponential inflation mega-trend which vested interests and what can be only termed as deflation fools have been blindly regurgitating the threats ever since the Great Recession of the 2008-2009, which the graph clearly illustrates amounted to nothing more than a mere blip or as I warned at the time as being a mere deflationary ripple on the surface of an ocean of Inflation.
The Inflation Mega-trend Ebook of Jan 2010 (FREE DOWNLOAD), re-iterated that asset prices tend to be LEVERAGED to Inflation, which is precisely the trends that have subsequently transpired from stocks to commodities such as Gold and as I have been flagging during 2012, is expected to transpire for UK and US housing markets so it does not really matter if actual inflation is far higher than official inflation which means it is not necessary to focus on alternative inflation measures if one acknowledges that asset prices tend to be leveraged to official inflation data that go through the stages of being over sold or over bought against inflation due to the impact of investor sentiment. $1 Trillion Coin Ultimate Fiat Currency Illustrates Exponential Inflation Paul Krugman (clueless academic economist) can be seen smugly gloating in the mainstream media as one of his crackpot ideas for the US Treasury to Mint $ 1trillion Dollar Platinum coins with an intrinsic value of about $1,500 (poor Gold bugs, decades of expecting a Gold Standard all the while sneaky platinum bugs had been plotting their own standard), so that the Fed can use them to buy U.S. debt / finance the annual $1 trillion budget deficit and thus end America's exponential debt crisis. So, according to Krugman and most politicians and academic economists is for the US to print money to infinity as a means of conjuring economic growth out of thin air i.e. without having had to earn the money that the US Government will seek to spend. However this does give the general public a window into the game that bankers and politicians are playing and that is one of perpetual money printing the consequences of which is an exponential inflation mega-trend. The madness of the Trillion dollar coin should be obvious to all that if ever the United States did start to mint trillion dollar coins as a means of directly monetizing its debts then it should also replace its stars and stripes with that of Weimar Germany, because no one is going to hold a currency that can be latently so literally printed to infinity within minutes as people can imagine the U.S. Treasury churning out bucket loads of $ 1 trillion dollar coins, then $10 trillion, $100 trillion, $1000 trillion etc... In reality, I doubt that it is actually going to happen, as it is much easier for the people to be confused by the Quantum of Quantitative Easing than see the reality of $1 trillion coins being minted. In terms of US Debt, the Trillion dollar coin is just as ridiculous as the debt ceiling, which means that the debt ceiling will probably eventually be abolished. In terms of PHD Economists - Fiat academia is equally just as worthless to the real world. In terms of hyperinflation - A trillion dollar coin would be a giant leap towards Hyperinflation because once it starts to be minted, it will prove just too tempting to keep minting the coins to pay the bills. In terms of the housing market, know this that whilst governments can easily print currency in all of its forms, however they cannot so easily print houses! The bottom line is that the Trillion dollar coin would be the latest example of fiat currency fraud, for it not to be classed as fraud then the coin would need to weigh about 21,000 tonnes, which is about triple the total amount of platinum ever mined in history! Affordability Illustrates leverage - Falling house prices coupled with static to rising incomes (inflation) illustrates the impact of leverage on the housing market i.e. mortgagees tend to borrow 3.5X earnings, so if earnings have risen by 10% and house prices have fallen by 30%, then that results in an increase of 65% in affordability on where house prices were at the 2006 peak i.e. generally speaking US housing is 65% more affordable against 2006, i.e. a house that cost $200k in terms of borrower affordability at the peak is equivalent to buying a house for $107k today, or near half the peak price. This is reflected in the US affordability index as compiled by NAR that is said to have hit a new all time high of 198.2 New Home Sales Inventory - Hits a 50 year low due to lack of construction during the past 4 years, whilst existing home sale inventories are at a 10 year low as potential sellers are refusing to sell at deep discounts or negative equity. This translates into the US housing market being primed to take off as a consequence of the multiple competing offers lifting sale prices. On the flip side, once a US housing bull market gets going, so will construction of new homes. It is too early in the cycle to say how this will impact house price trends as there are competing consequences i.e. the more construction the greater the confidence to buy / invest / speculate. Demographics - The main demographic mega-trend in the western world if not the whole world is that of an ageing population, what this translates into is an ever decreasing ratio of workers to non workers, for countries such as the UK this crisis is exacerbated by out of control welfare states as a consequence of Labour party creating a pool of vested interest voters who are heavily reliant the welfare state. The key consequence of a falling ratio of workers to non workers is that workers will have less disposable income to feed a housing bull market and thus act as a damper on the housing market. However, the advantage that the US has by virtue of ample land is that it can literally open the flood gates to new arrivals and thus give the economy and the housing market a boost as the number of workers to non workers increases. The key is that the US has an INCREASING population, so all of the commentary that suggests the US is following Japan is NOT going to happen because of this fundamental difference in that Japan's population is declining, with expectations for it to drop by 30% over the next 40 years, whilst US population is expected to increase by more than 30%, so regardless of demographics - that is a lot of demand for new homes to be built! US Housing Market Buy Trigger? The below graph illustrates the state of the US Housing market in terms of its primary long-term driver - inflation, and answers the question posed at the start of this analysis in that has the US housing market triggered a buy signal as defined in June 2008 (US House Prices Forecast 2008-2010) i.e. following the expected real terms downtrend into early 2011.
The graph shows that following the expected real terms downtrend forecast into early 2011, continued into the end of 2011 and that subsequently the embryonic bull market of 2012 has triggered a BUY SIGNAL ON the LAST Case Shiller data release (October 2012), that will likely be confirmed on the release of subsequent data over the coming months. U.S. Housing Annual Market Momentum The house price momentum graph shows annual extreme swings of +20% to the Bull market peak and then -20% to the bear market low. This was followed by a corrective swing higher to +5% which then dissipated to -5%, thus unwinding reactions to the preceding 40% swing and sets the scene for a normalisation of momentum for the US housing market over the coming years.
Whilst it is a little too early to determine what the precise momentum will be, however looking back at the preceding bull market suggests that once momentum breaks above 5% per annum, then this is likely to accelerate into a range of between 8% to 12% per annum. Current rising momentum of 3.4% puts the US housing market on achieving such a trajectory during 2013 which implies that US house prices could rise by between 8% to 12% for 2013! US Housing Market Forecast 2013-2016 My analysis has now reached the point where I am confidently able to generate a high probability multi-year trend forecast for US house prices. As mentioned earlier, the fundamentals have already triggered a reliable technical buy trigger, and as illustrated by rising real-terms momentum implies an accelerating trend for the US housing market over the coming years, i.e. as each years % gains prompts higher % gains in the following year as a consequence of ever improving market sentiment that will lead all the way towards the next bubble peak many years from now, but for this analysis I will focus on a trend forecast for over the next 3 years, dating from the last 2 months of of 2012 right through to early 2016 (Case Shiller index) as illustrated by the the below trend graph around which the actual house price index is expected to oscillate.
US House Prices Forecast Conclusion - As your read this, the embryonic nominal bull market of 2012 is morphing into a real terms bull market of 2013, with each subsequent year expected to result in an accelerating multi-year trend that will likely see average prices rise by over 30% by early 2016, which translates into a precise house prices forecast based on the most recent Case-Shiller House Price Index (CSXR) of 158.8 (Oct 2012 - released 26th Dec 2012) targeting a rise to 207 by early 2016 (+30.4%). Implications of an Multi-year Real Terms Housing Bull Market The key implication is that everything that was hated during the housing bust should therefore be loved going forward such as bank stocks! After all, the big banks can never go bust because they will always be bailed out. The central banks of the world have clearly told us what they are going to do and are in fact doing which is to INFLATE all of the debts away for which they do not need gimmicks such as the Trillion Dollar coins to achieve. Therefore House Price Inflation is one of the few avenues open to ORDINARY people to leverage themselves up to the central banks exponential inflation policies and bank stock prices are LEVERAGED to House Prices! i.e. 10% House price increase can in many cases result in a 100% increase in bank stock prices! Inflation WARNING! This is how it is - If I chose not to do nothing i.e. not buy property or dividend paying stocks or other assets leveraged to inflation then I KNOW inflation will wipe out ALL of my wealth and earnings purchasing power - That IS a certainty!, whilst everything else is a probability, risk vs reward, as I continue to attempt to leverage my assets and earnings to inflation, as illustrated by the January 2010 Inflation Mega-trend ebook (FREE DOWNLOAD)
Also subscribe to our new youtube channel for video forecasts and additional educational material. Your analyst loading up on housing market exposure (UK). Source and Comments: http://www.marketoracle.co.uk/Article38458.html Nadeem Walayat Copyright © 2005-2013 Marketoracle.co.uk (Market Oracle Ltd). All rights reserved. Nadeem Walayat has over 25 years experience of trading derivatives, portfolio management and analysing the financial markets, including one of few who both anticipated and Beat the 1987 Crash. Nadeem's forward looking analysis focuses on UK inflation, economy, interest rates and housing market. He is the author of three ebook's - The Inflation Mega-Trend; The Interest Rate Mega-Trend and The Stocks Stealth Bull Market Update 2011 that can be downloaded for Free.
Disclaimer: The above is a matter of opinion provided for general information purposes only and is not intended as investment advice. Information and analysis above are derived from sources and utilising methods believed to be reliable, but we cannot accept responsibility for any trading losses you may incur as a result of this analysis. Individuals should consult with their personal financial advisors before engaging in any trading activities.
You're receiving this Email because you've registered with our website. How to Subscribe Click here to register and get our FREE Newsletter To access the Newsletter archive this link Forward a Message to Someone this link To update your preferences this link How to Unsubscribe - this link
The Market Oracle is a FREE Financial Markets Forecasting & Analysis Newsletter and online publication. | ||||||||||||||
 Since which time the bear market in US housing has continued to act as a drag on the US economy, holding it back from recovery, in response to which the US government and central bank have sought to escalate their response in an attempt at engineering an economic bounce so as to induce an sustainable economic recovery of which the